New opportunities
More than a dozen additional visualization options
Regular updates
Always up to date and ready to use for any PI Vision version
Embed Seeq analyses
Display analyses prepared in Seeq directly in PI Vision
First class support
Direct contact with PI System experts around the clock
We offer various products for the OSIsoft PI system. In addition to various services, this also includes our PI Vision Suite. With the help of the PI Vision Suite, you receive new PI Vision Controls or PI Vision Symbols, which can be installed directly in PI Vision and then easily inserted into the already existing PI system and can be created and configured directly in the browser like the standard models.
If the PI Vision Suite is not sufficient for you, we will develop customised PI Vision Controls for you and add them to the PI Vision Suite.
Your advantages of the subscription
- Regular updates
- All controls are adapted to your PI Vision version and kept up to date.
- Influence on the next controls to be added to the PI Vision Suite
AVEVA PI Vision
PI Vision is a self-service dashboarding tool for contextual viewing, on-the-fly analysis, and secure sharing of your AVEVA PI system data – accessible anywhere and on any device. Aveva PI Vision is a web-based data visualization software designed for monitoring and analyzing process data in the manufacturing and process industries. With the PI system, you move from complex to simple, from plant and process insights to operational intelligence. The PI System’s highly scalable, open data infrastructure provides organizations with real-time functionality, enabling the transformation of operational data into actionable insights and business transformation. PI Vision offers the ability to add homegrown extensions to the controls already included. This is where we come in. We offer you add-ons for PI Vision that are perfectly tailored to your requirements. So you get the most out of your data.
The advantages of Aveva PI Vision are:
- Real-time monitoring of process data
- Easy configuration and use
- User-friendly data visualization
- Integration with other systems
- Creation of overview and transparency in processes
- Support for decision making through data analysis.
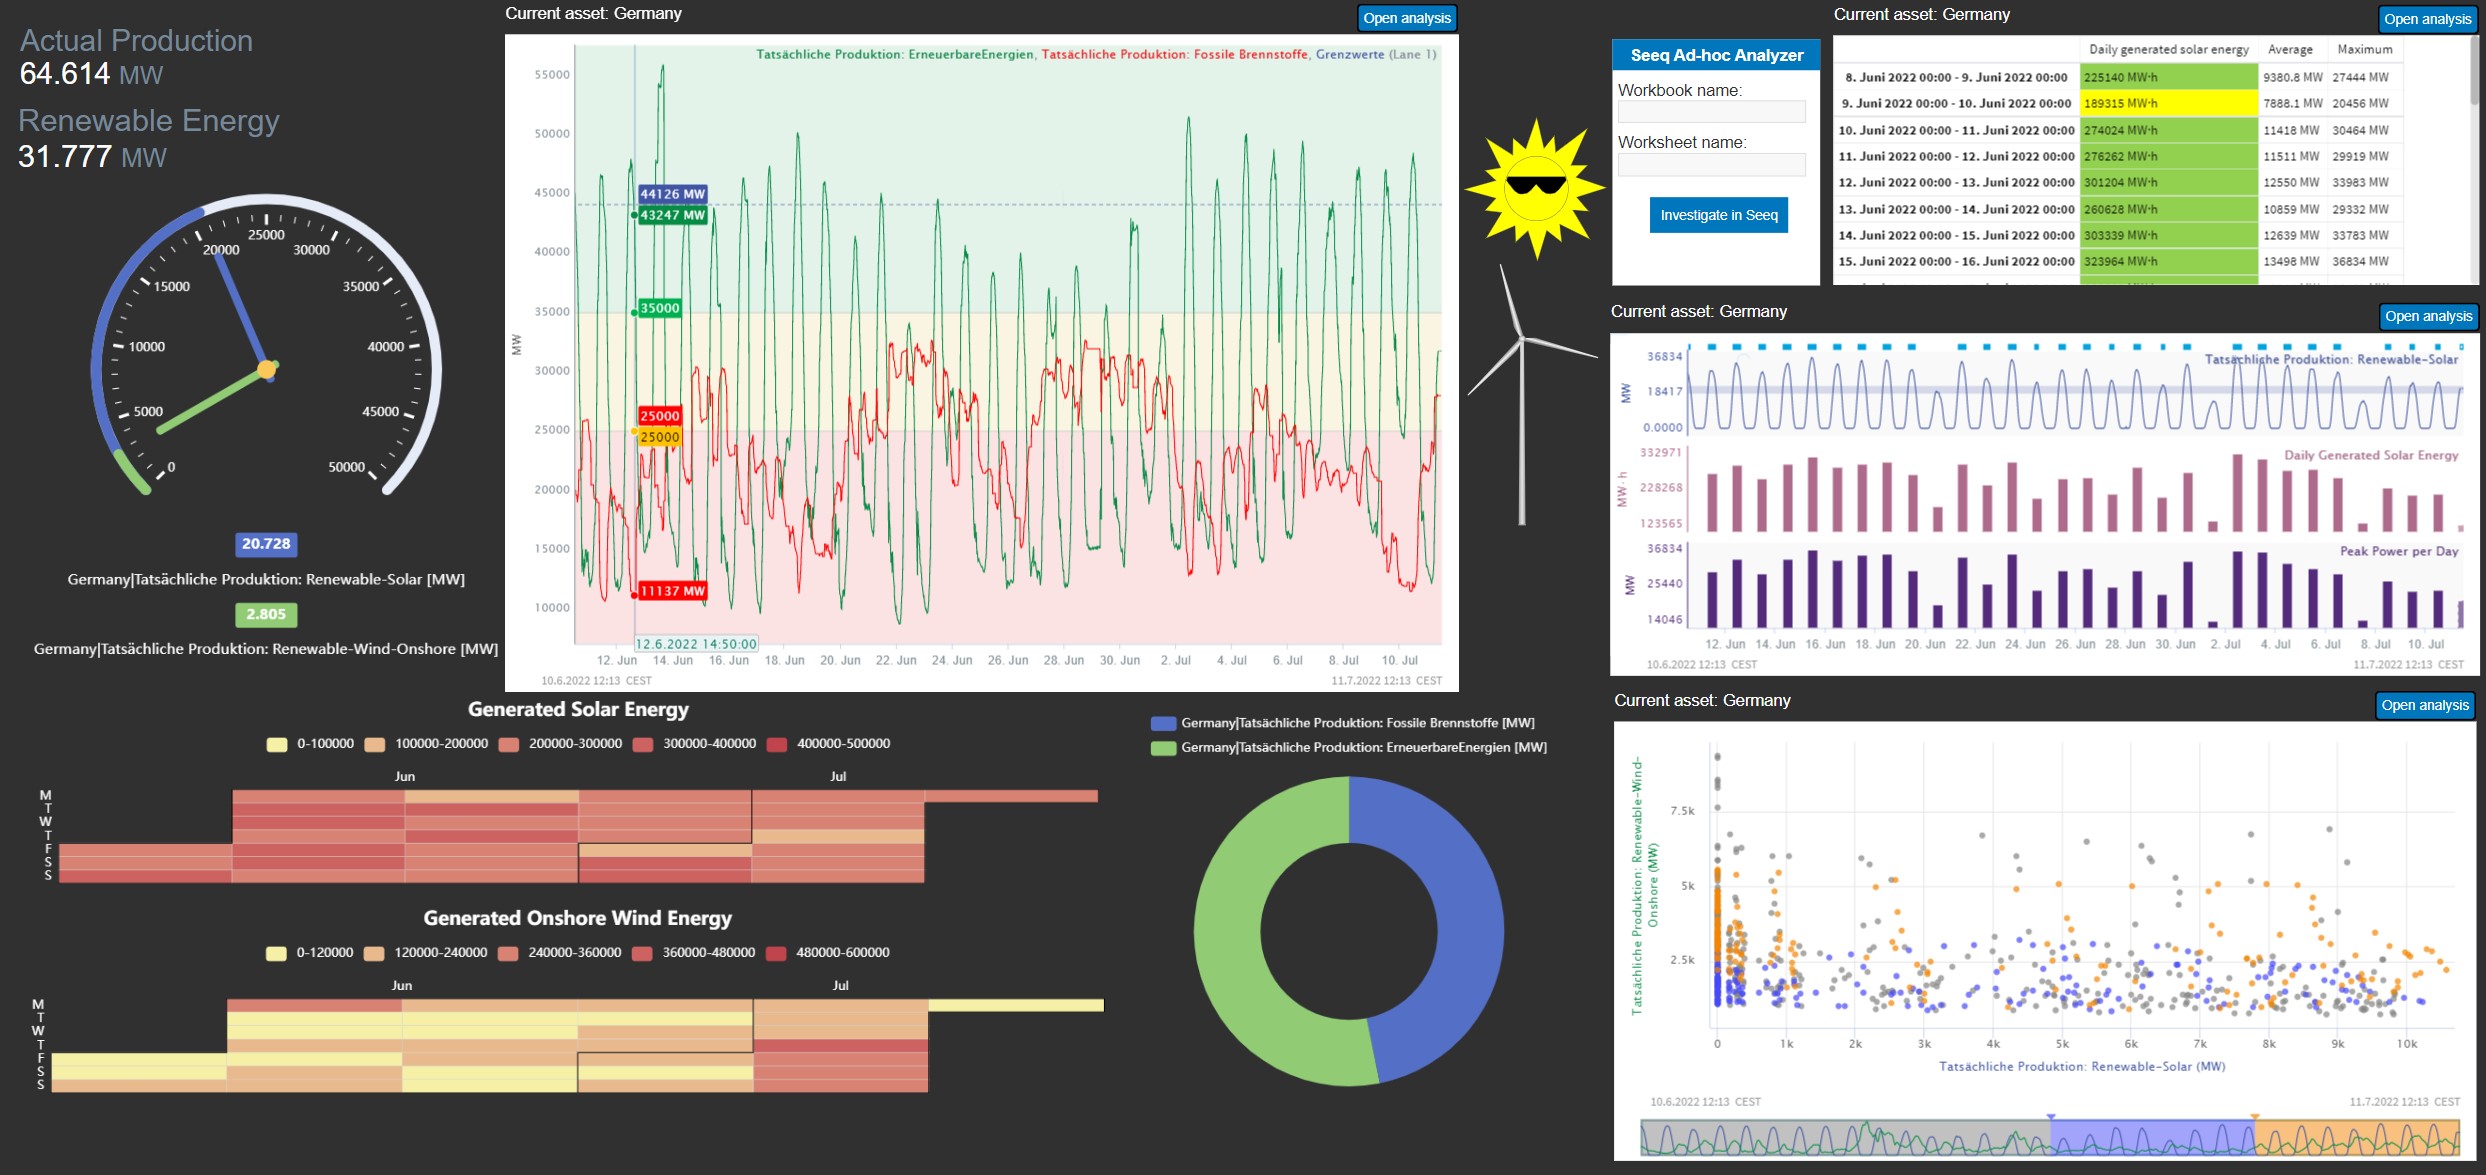
Seeq Integration
Seamless integration of your Seeq analytics.
Werusys PI Vision Suite allows you to seamlessly integrate all analyses and reports created in Seeq into PI Vision.
Dynamic time intervals
Time ranges selected in PI Vision are applied directly to the Seeq content displayed.
Advanced monitoring options
With the help of Seeq, you can greatly expand the capabilities of your PI Vision Monitoring and get a wide range of analysis tools and visualizations.
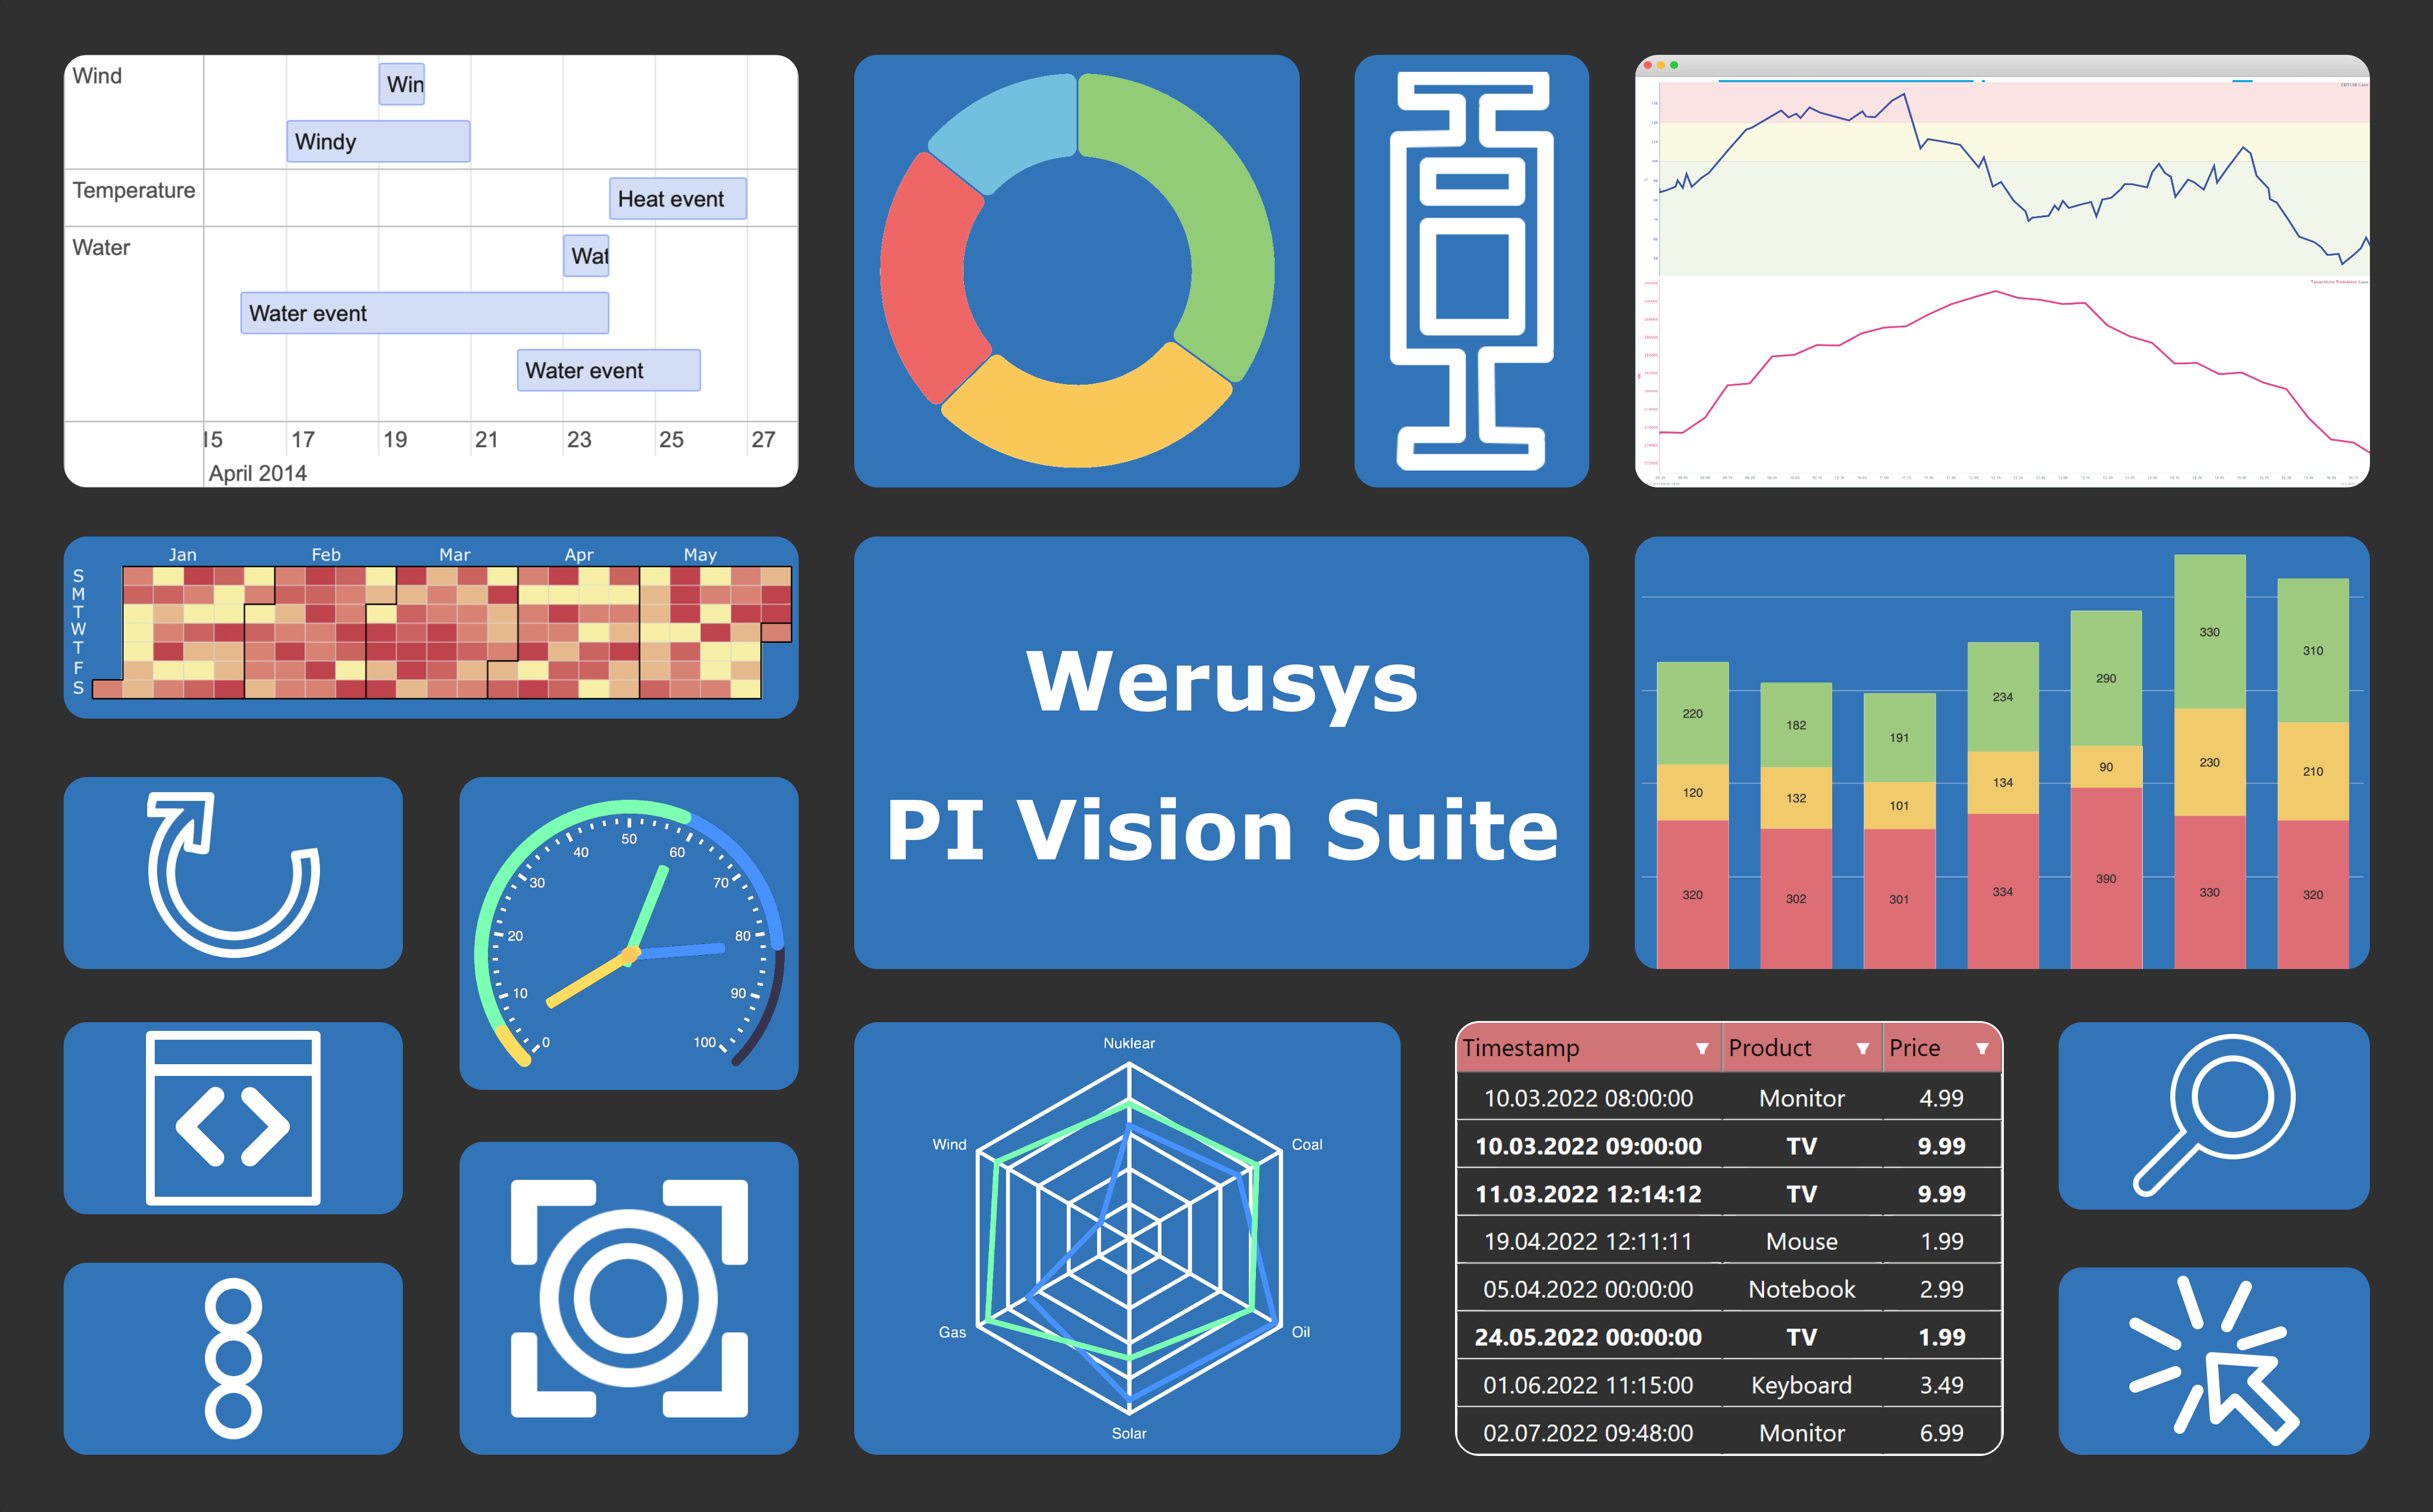
PI Vision Suite Controls/Symbols
Auto-Reload
The Auto Reloader reloads the PI Vision at regular and configurable intervals. This makes it possible, for example, to prevent manual intervention in the vicinity of a control room if the connection is lost after a long browser session.

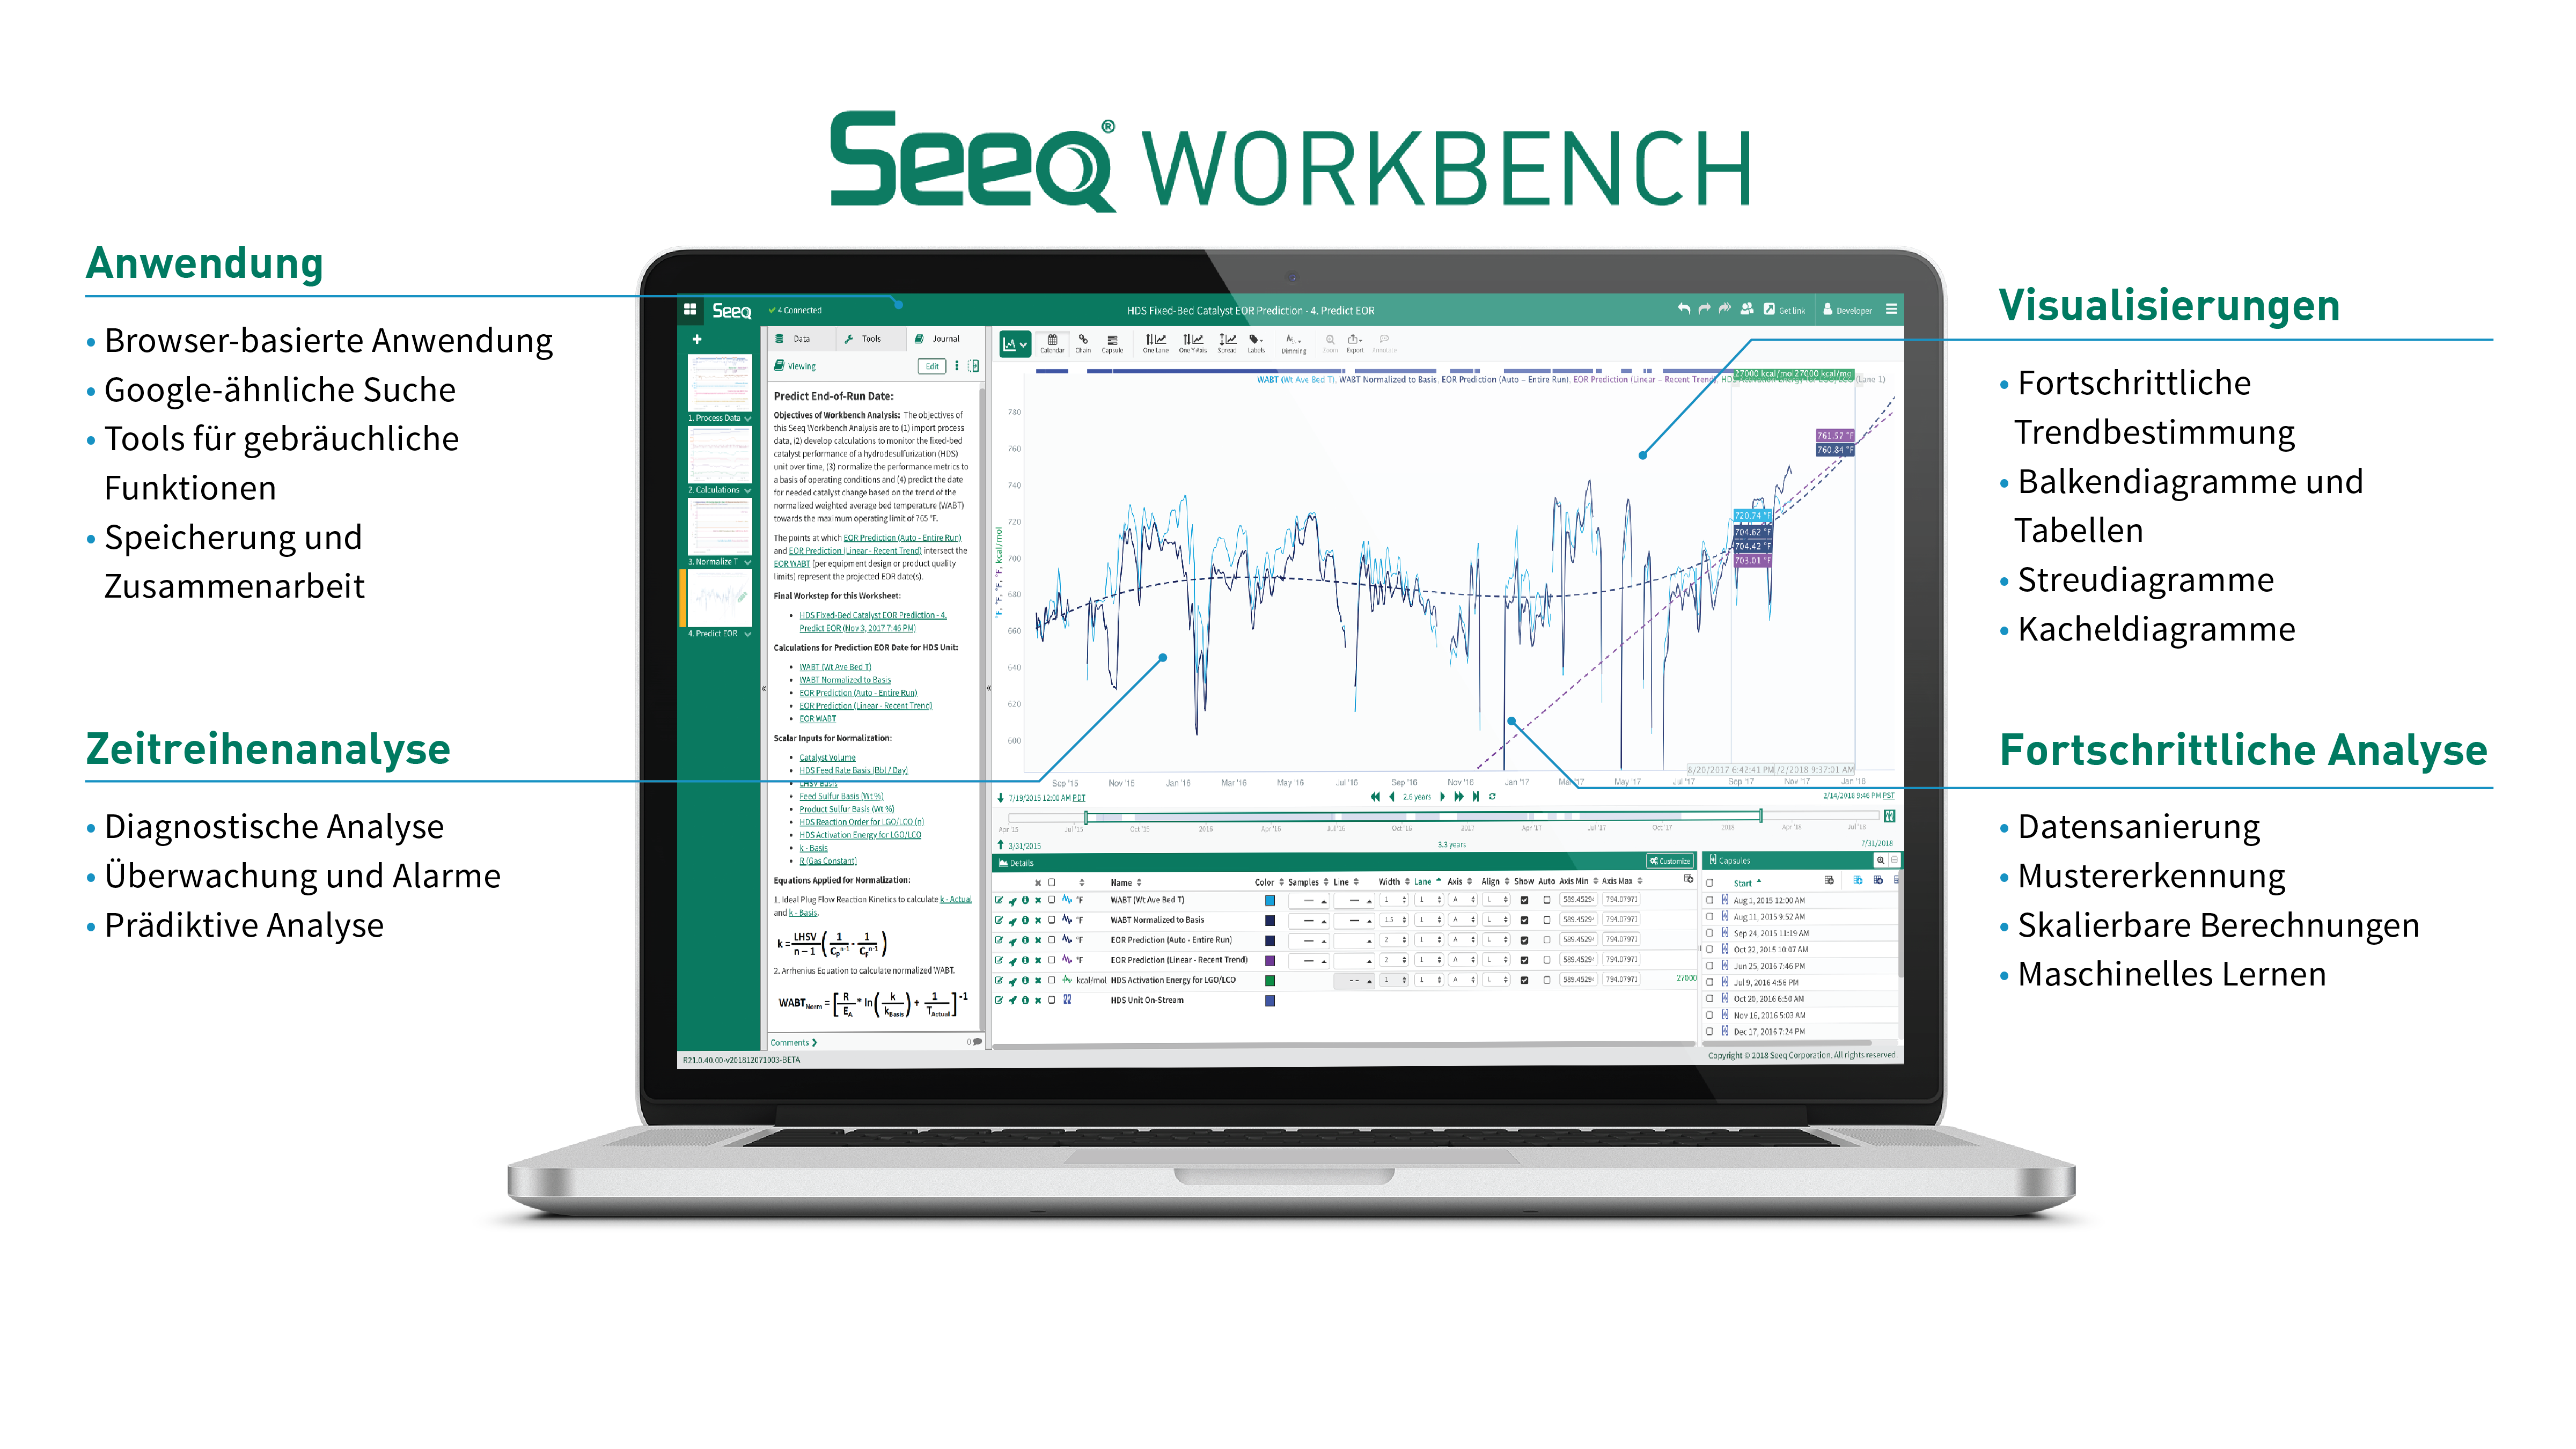
Seeq Visual Workbench
Seeq Visual Workbench provides users with direct access to predefined Seeq Workbench analyses and organizer dashboards. This allows PI Vision users to equally take advantage of Seeq and PI Vision.
Seeq analyses can be seamlessly embedded into any PI Vision display and automatically adjust to the selected PI Vision time interval.

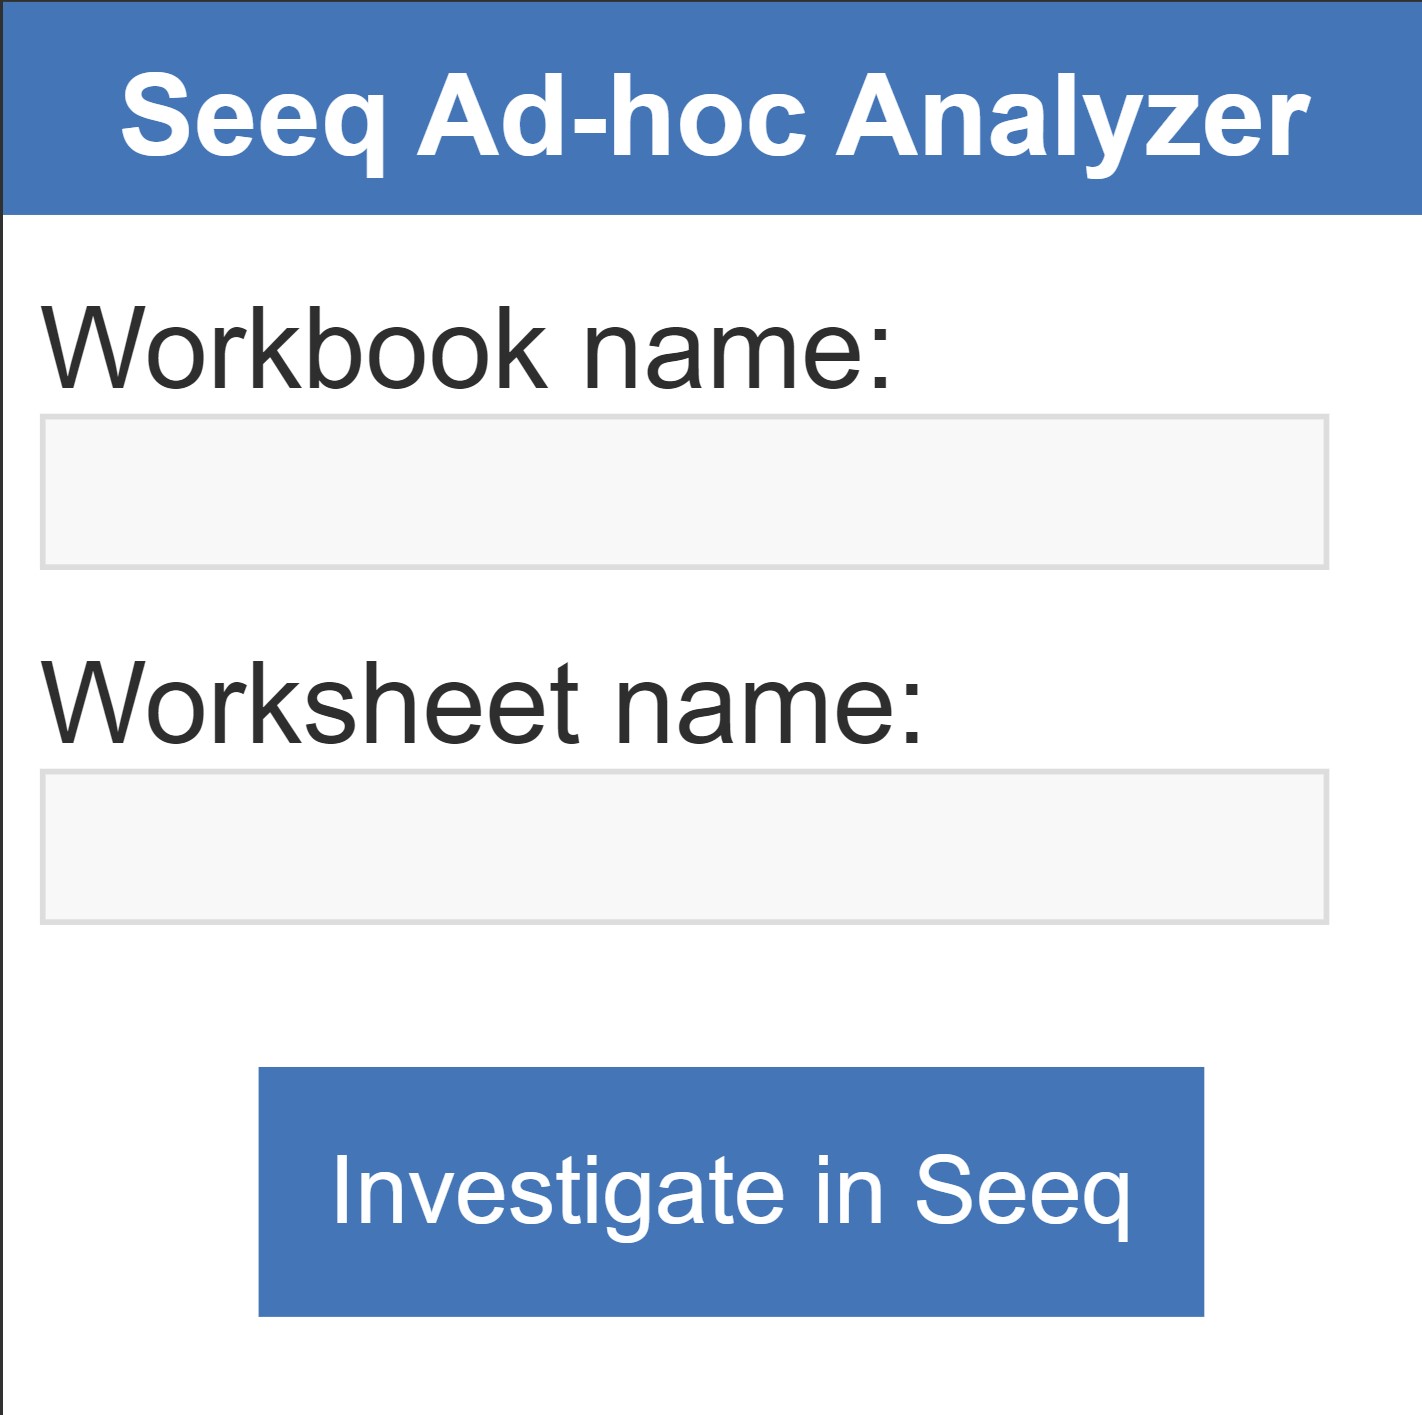
Seeq Ad-Hoc Analyzer
The Seeq Ad-Hoc Analyzer allows the user to further investigate any PI Vision Display directly in Seeq and gather new insights. Based on the selected PI Vision Display, a Seeq Workbench analysis is created and can be further investigated directly in Seeq.
Gauge
The Gauge is a beautiful and easily customisable control for displaying the current value of an attribute. The PI tag displayed can be adjusted by dragging and dropping the corresponding PI attribute.

Multi Signal Gauge
The multi-signal gauge can be used to display multiple values for different assets at the same time. As with the standard gauge, PI tags can be added by dragging and dropping the appropriate PI attribute.

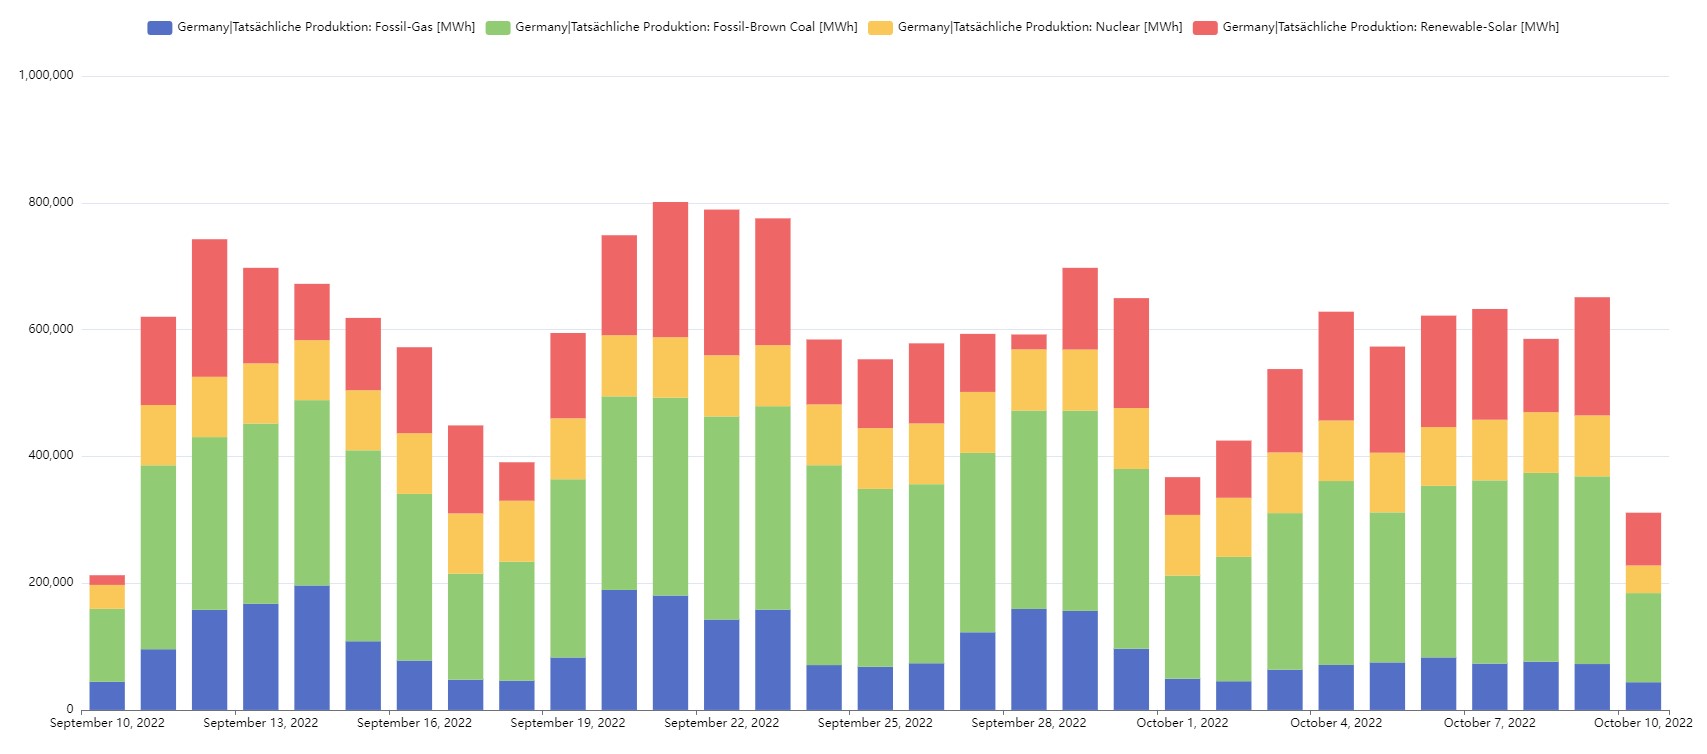
(Stacked) Bar Graph
The bar chart represents categorical data with rectangular bars whose height or length is proportional to the values they represent. The bars can be drawn vertically or horizontally. The user can add new signals using PI Vision’s normal drag-and-drop interface.
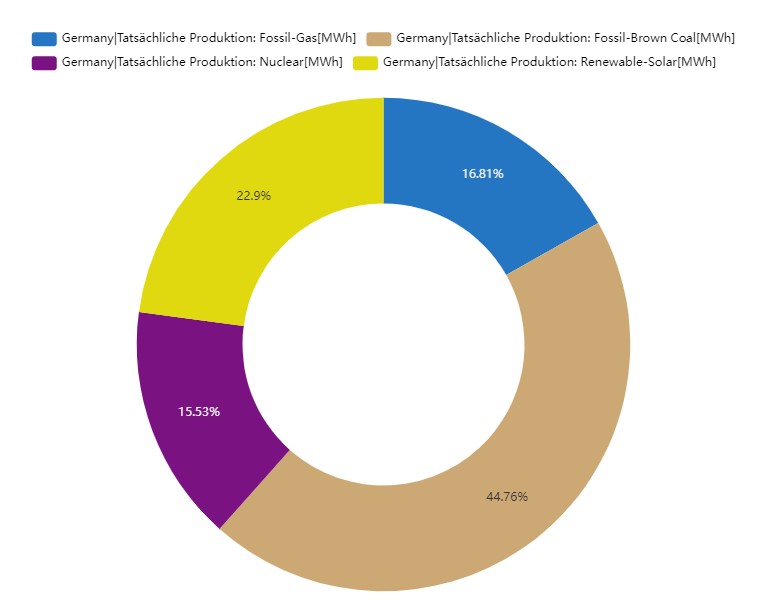
Doughnut-Chart
The Doughnut Chart widget allows data to be visualised in a doughnut chart. The widget can be configured to show the percentage of each value.
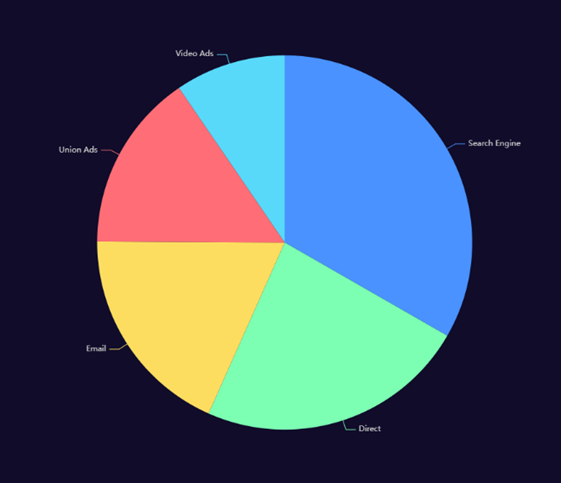
Pie Chart
The pie chart widget enables the visualisation of data in a pie chart. The widget can be configured to show the percentage of each value.
Radar Plot
The radar plot makes it possible to visualise several attributes at different points in time. The point in time to be compared can be freely configured.

Embedder Control
The Embedder Control offers the user the possibility to display a configurable website directly in PI Vision.
Click Trend
The Click Trend Control offers the possibility to display and compare the signal curves of all controls on the PI Vision display with just one click. The time periods can be quickly changed and compared regardless of the time range selected in PI Vision.

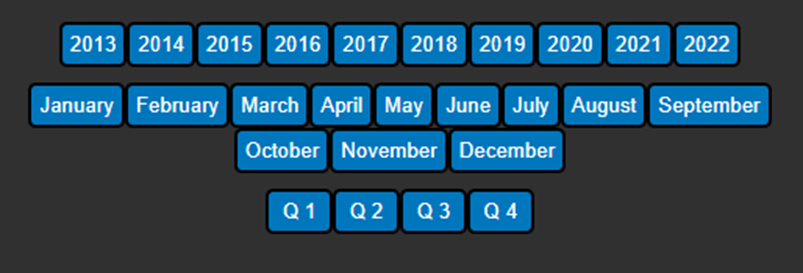
Date Picker
The DatePicker Control allows the user to change the time range of the PI Vision display with just a few mouse clicks, enabling a fast and precise workflow.
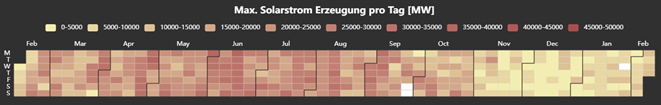
Heat Map
The heat map creates a graphical representation of data using a colour coding system to represent different values. The user can select different statistics to be displayed for each time window.
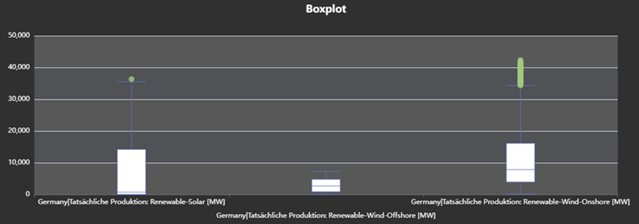
Box Plot
The boxplot (also known as box and whisker chart) can be used to visually display the distribution of numerical data and skewness by showing the data quartiles (or percentiles) and averages. It is possible to add multiple PI attributes by dragging and dropping.
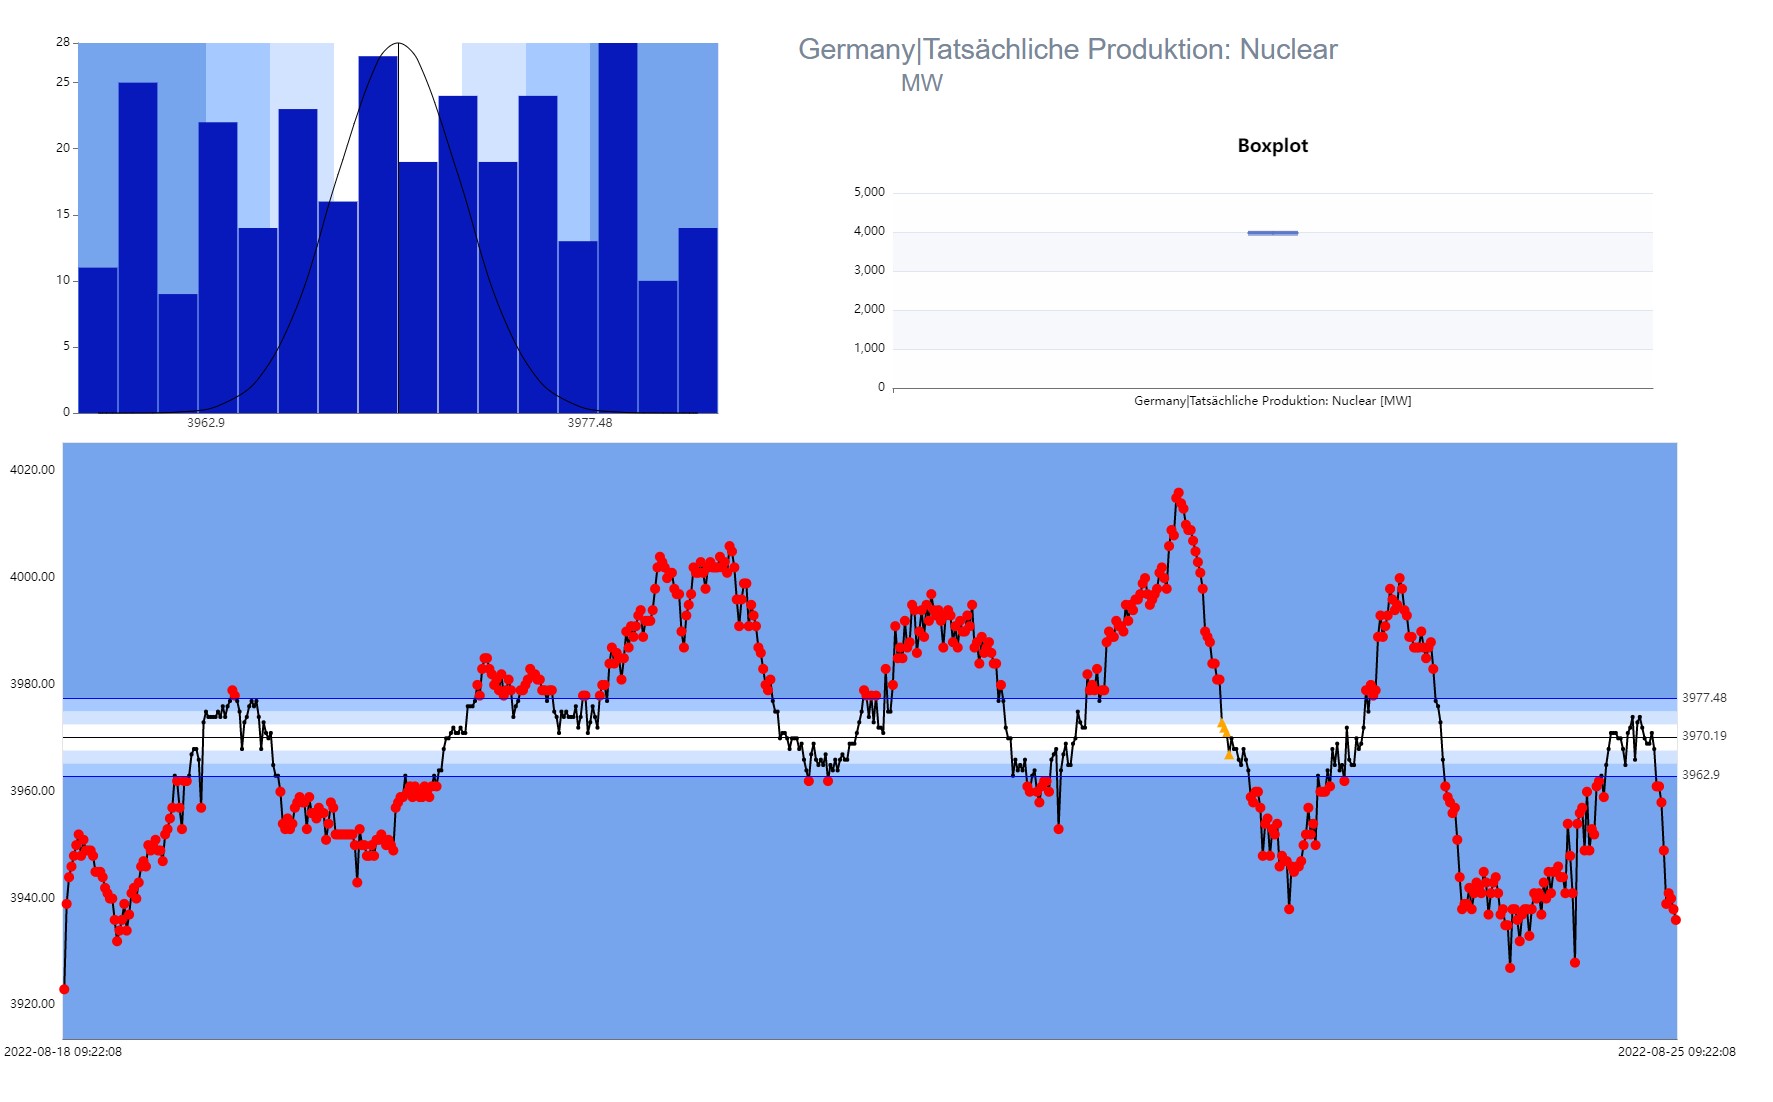
Histogram
Have you ever wondered how your data is distributed? Would you like to get more statistical information and even detect outliers?
Then you might like this new control. With the new Histogram control, visualizing data distribution has never been easier. Select a few tags, specify the number of bins you want, and you’re done!
A histogram is a graphical representation of the frequency distribution of cardinally scaled features. It requires dividing the data into classes, which can have a constant or variable width. The height of each rectangle then represents the (relative or absolute) frequency density, that is, the (relative or absolute) frequency divided by the width of the corresponding class. The histogram can be easily added to a PI Vision display by dragging and dropping a PI attribute or PI tag.
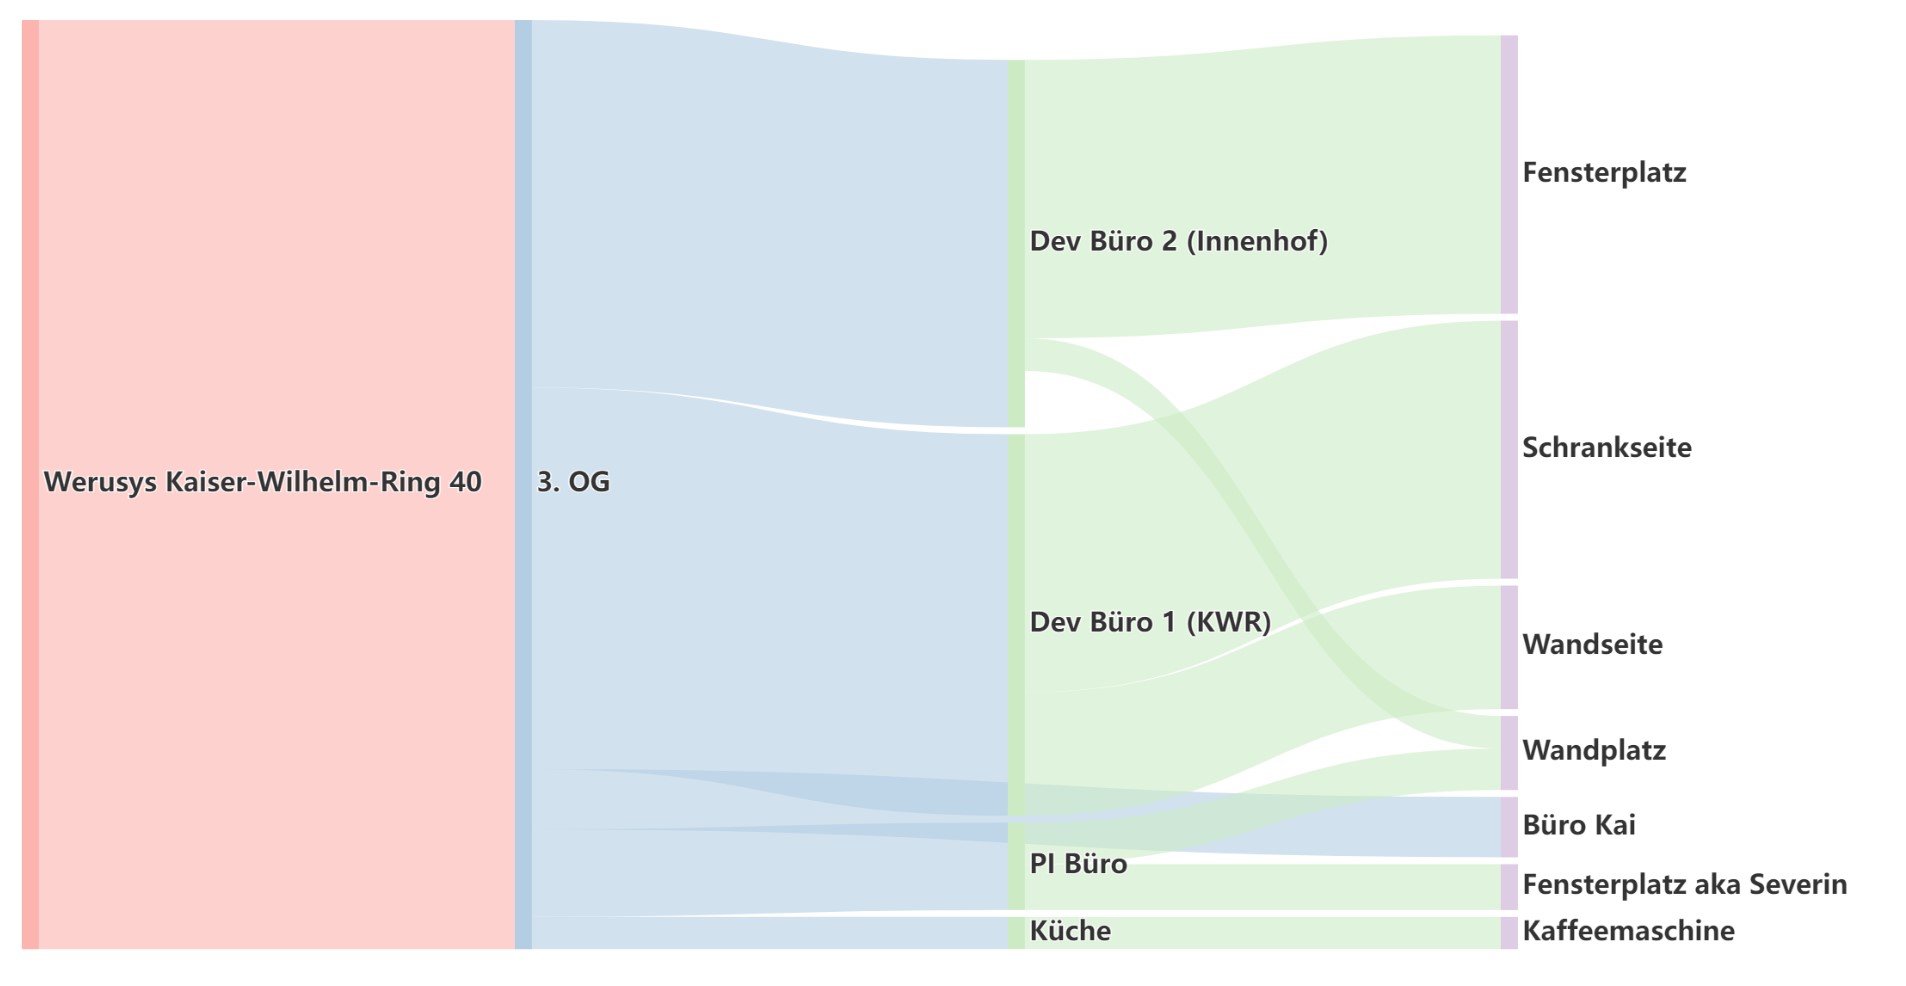
Sankey Diagram
The Werusys Sankey symbol can be used to display aggregated values in a diagram where the width of the connection is proportional to the size of the value. Sankey diagrams are important tools for visualizing energy and material flows as well as inefficiencies and potential savings in the use of resources. These are often material flows in a process or energy consumption in a company. This gives the user the opportunity to get a quick overview of flows within his company.
The visualization by the Sankey symbol makes it possible to easily identify large flows within a company or process: They are useful to identify large contributions in an overall flow.
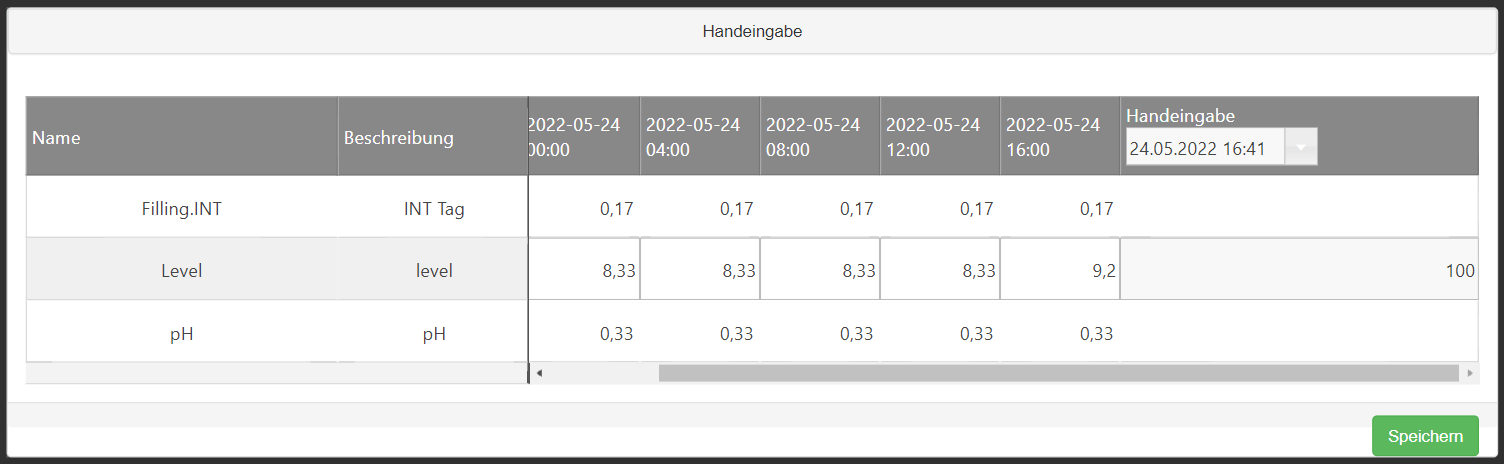
Manual Data Entry
The PI Vision Manual Data Entry control allows manual entry on definable PI Tags. The displayed PI tags are freely selectable and configurable. Furthermore, the number and sampling rate of the last acquired values can be set.
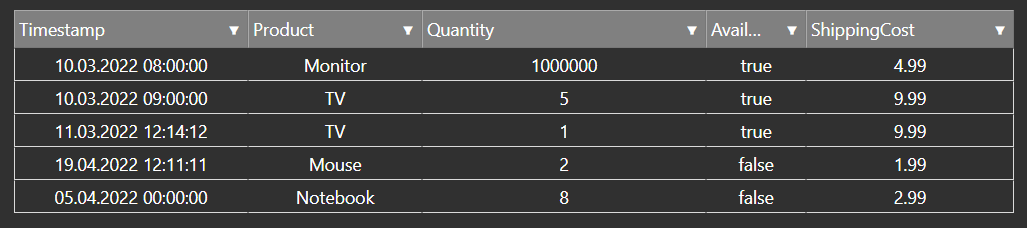
Tablesymbol
The table control offers the user the possibility to access AF tables and to display the stored data. The columns and column names can be configured freely. In addition, the appearance of the table can be changed via the configuration. This means, for example, that data from an SQL-based MES system can be displayed directly in PI Vision. Another example would be the display of CSV based data.
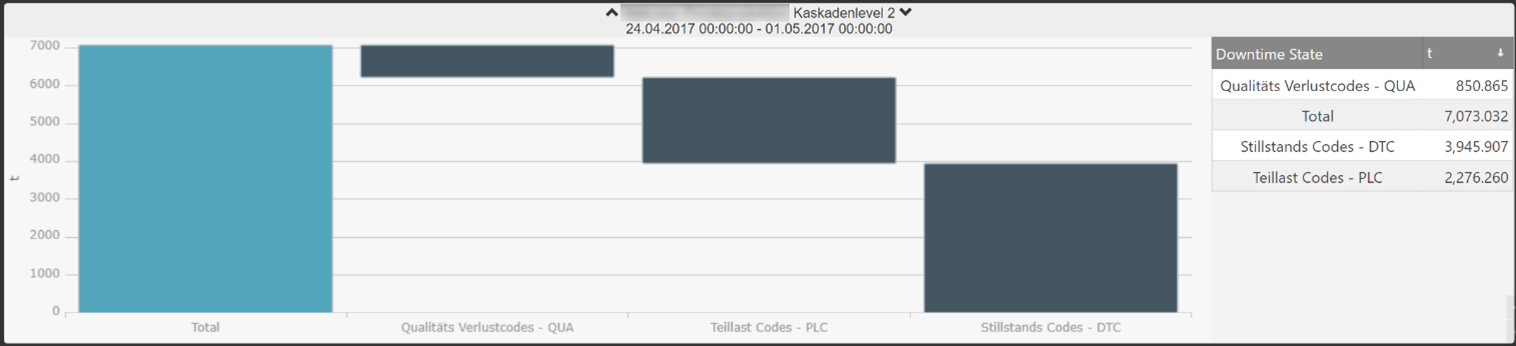
Asset Evaluation/ KPI / Loss Kaskade
The loss cascade summarises the different downtime codes in your installations and calculates the time the installation has spent in the different downtime codes.
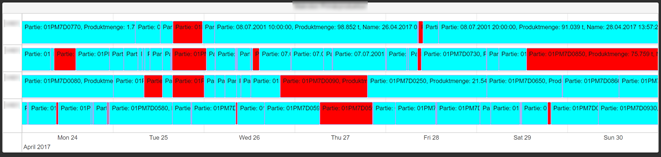
Gantt-Chart
Display of AF event frames in a Gantt chart, according to the time range displayed.
Allows the user to add customised information to event frames.
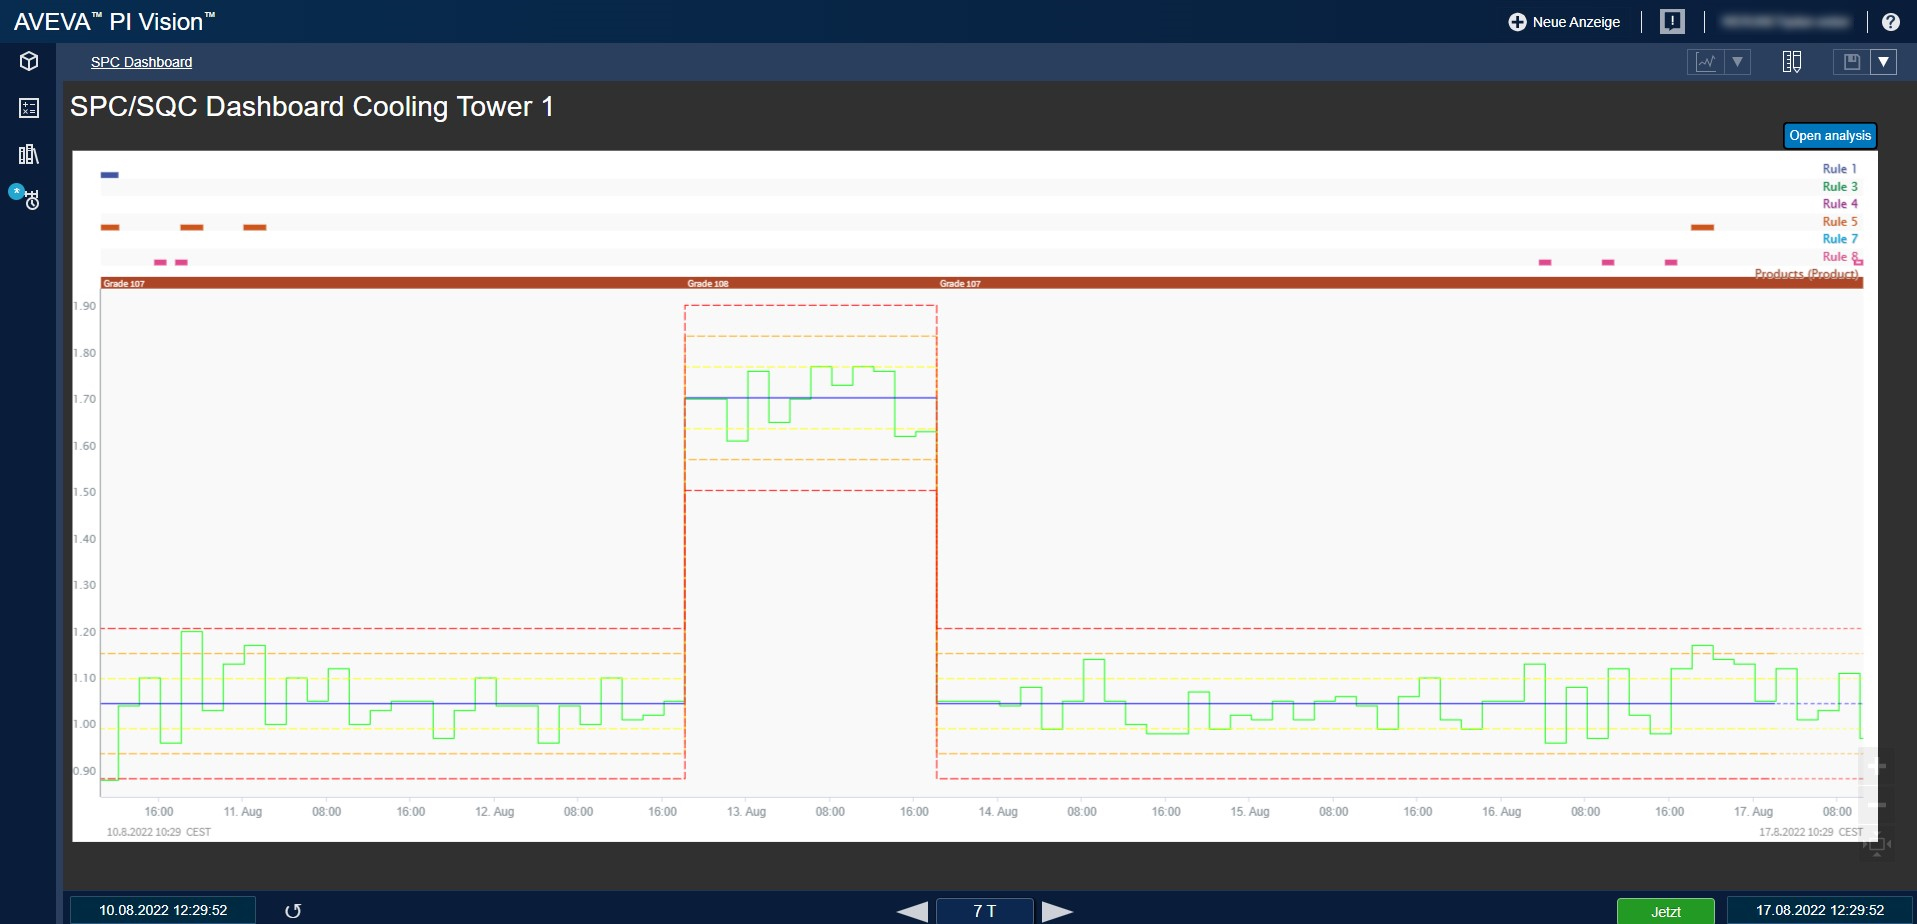
SPC/SQC in PI Vision
In the wake of the end of PI Process Book support, many companies are facing migration to the new PI Vision. One problem is the absence of a popular and useful feature of the Process Books – the SPC/SQC Control. This is where the developed Control for PI Vision comes in. This enables you to use all the features of the SPC Control in the new environment. Furthermore, the Werusys PI Vision Suite provides you with many other controls for PI Vision. In connection with a statistical evaluation of a process, a box plot is of particular interest.

SPC/SQC with Seeq
In Seeq, control charts and run control conditions can be created to monitor data in near real-time and flag when the data indicates abnormal or out-of-control behavior. The Werusys SPC Add-On for Seeq automates most of this task and allows users to efficiently and clearly monitor their process parameters. With the help of the Werusys PI Vision Suite, these analyses can be seamlessly integrated into PI Vision.
PI Vision High-Availability (PI Vision Suite Add-On)
Your PI Vision displays are used in a control room and a failure of the monitoring of your system should be prevented at all costs?
Then the PI Vision High-Availability Add-On for the Werusys PI Vision Suite is exactly what you need. The add-on manages your PI Vision displays in a redundant system and automatically detects if one of your PI Vision servers is shut down or no longer accessible.

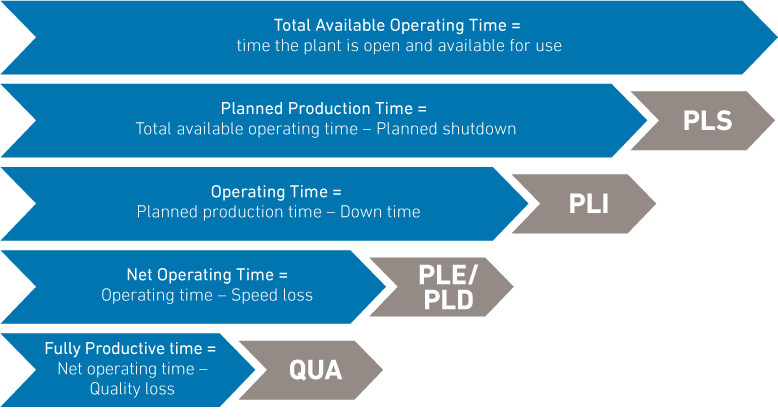
Downtime-Management
An example of such a control is the Downtime Management we have developed. With this control, we offer you downtime management in PI Vision as a control that can be added quickly. Because advanced planning is based on the planning of downtimes in production. There are planned and unplanned downtimes, but determining the most important production KPI the OEE (“Overall Equipment Effectiveness”) is also part of the analysis through loss cascades. Getting this data is usually one of the main problems. This is where the PI system in combination with our control comes in. Due to the ease of use, we enable you to receive this data with a few clicks directly in your browser in the form of an interactive timeline.
Our “Downtime Management” supports the customer with:
- Automated collection of downtime and uptime information,
- Adding the reasons for downtime,
- Clear monitoring (Gantt chart) directly in PI-Vision,
- Provision of analyses (tables, waterfall diagram) in PI-Vision,
- Management tool to manage the loss cascade
{%CAPTION%}
