Seeq Global Partner Symposium
Last week, Werusys joined Seeq and its global partner network in Las Vegas for the Global Partner Symposium. The team was excited to explore new opportunities for collaboration and continue to deliver business value to our mutual customers in 2023. Last year, Werusys was announced as the first member of the Seeq Partner Advisory Council. We are honored and look forward to working together to accelerate the delivery of advanced data analytics! Learn more in the video from our CEO Kai Weber 🚀 Learn more here: Werusys on the Seeq Advisory Council
Over the past year, we have partnered with Seeq to help many customers adopt an advanced analytics solution. The goal of the partnership is to accelerate digital transformation and leverage the capabilities of advanced analytics. With a team of 5 Seeq Analytics Engineers and 3 Seeq Instructors we are ready to support our customers in their digitalization journey in the best possible way.
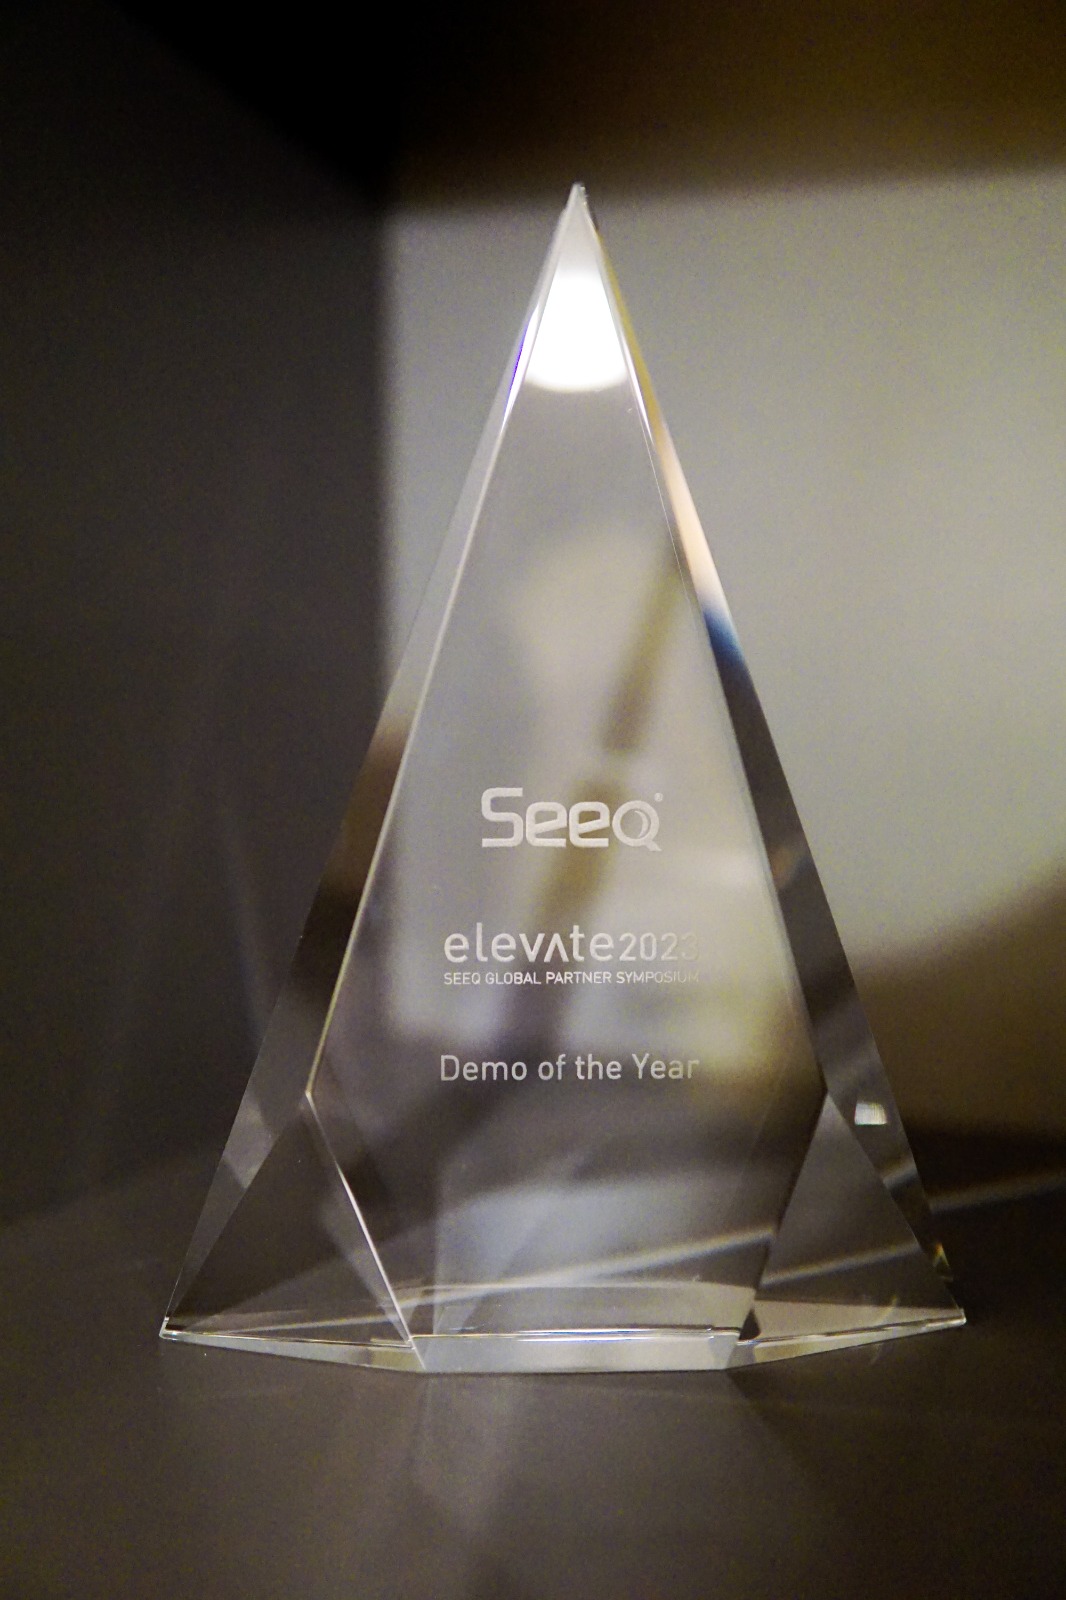
Seeq Demo of the year Award Winner
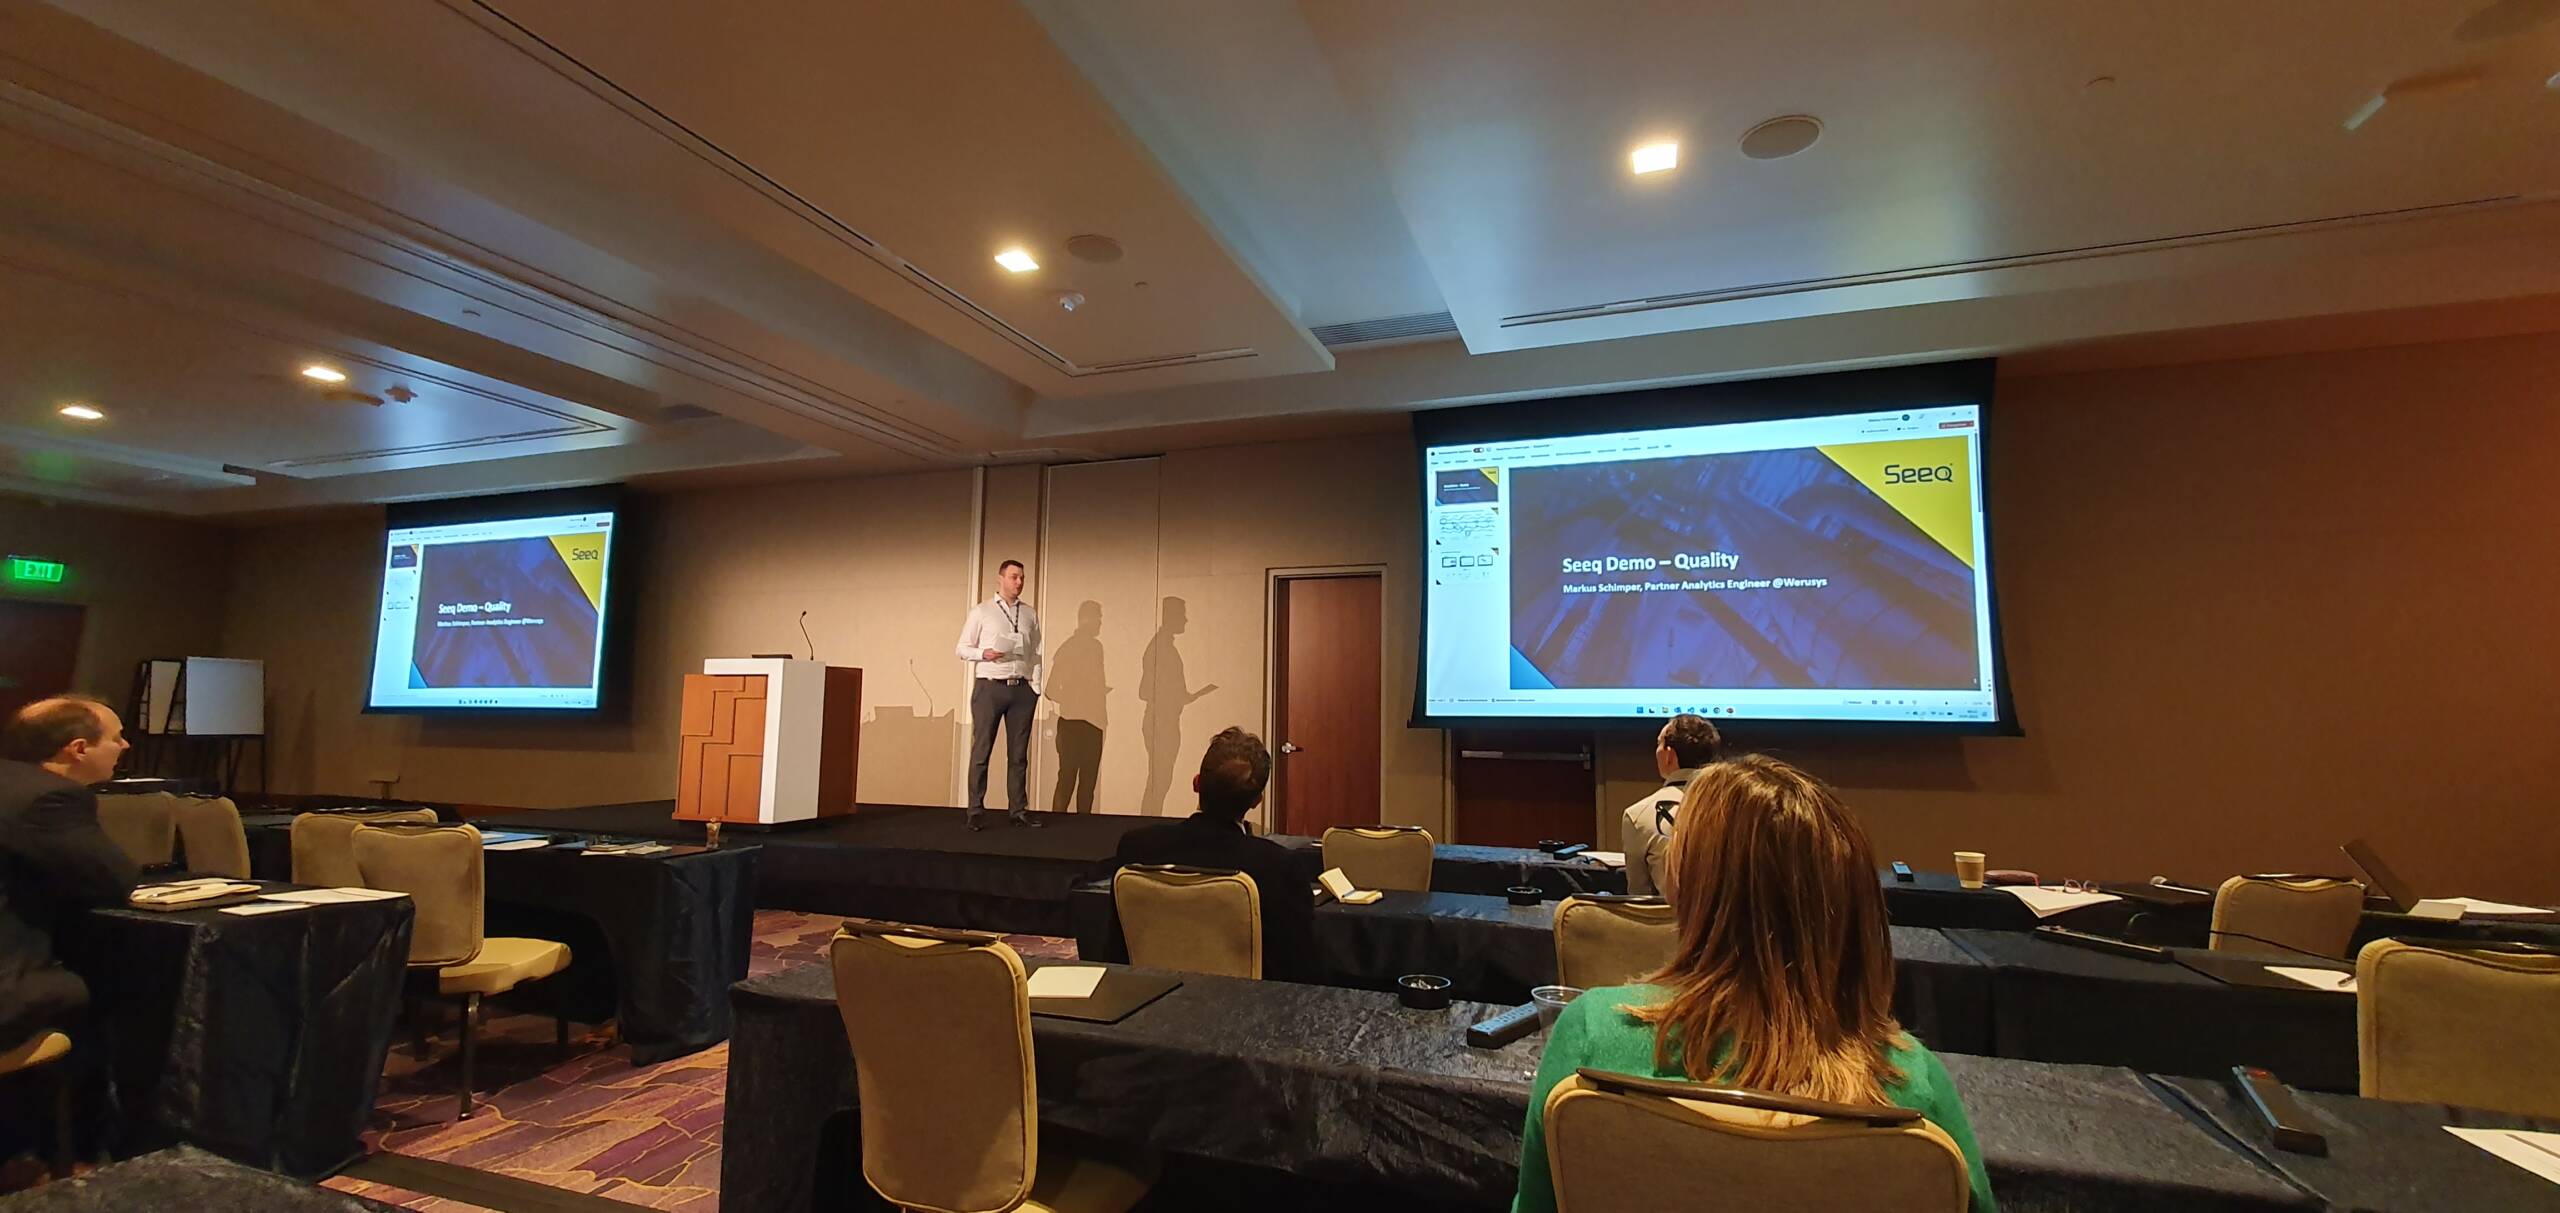
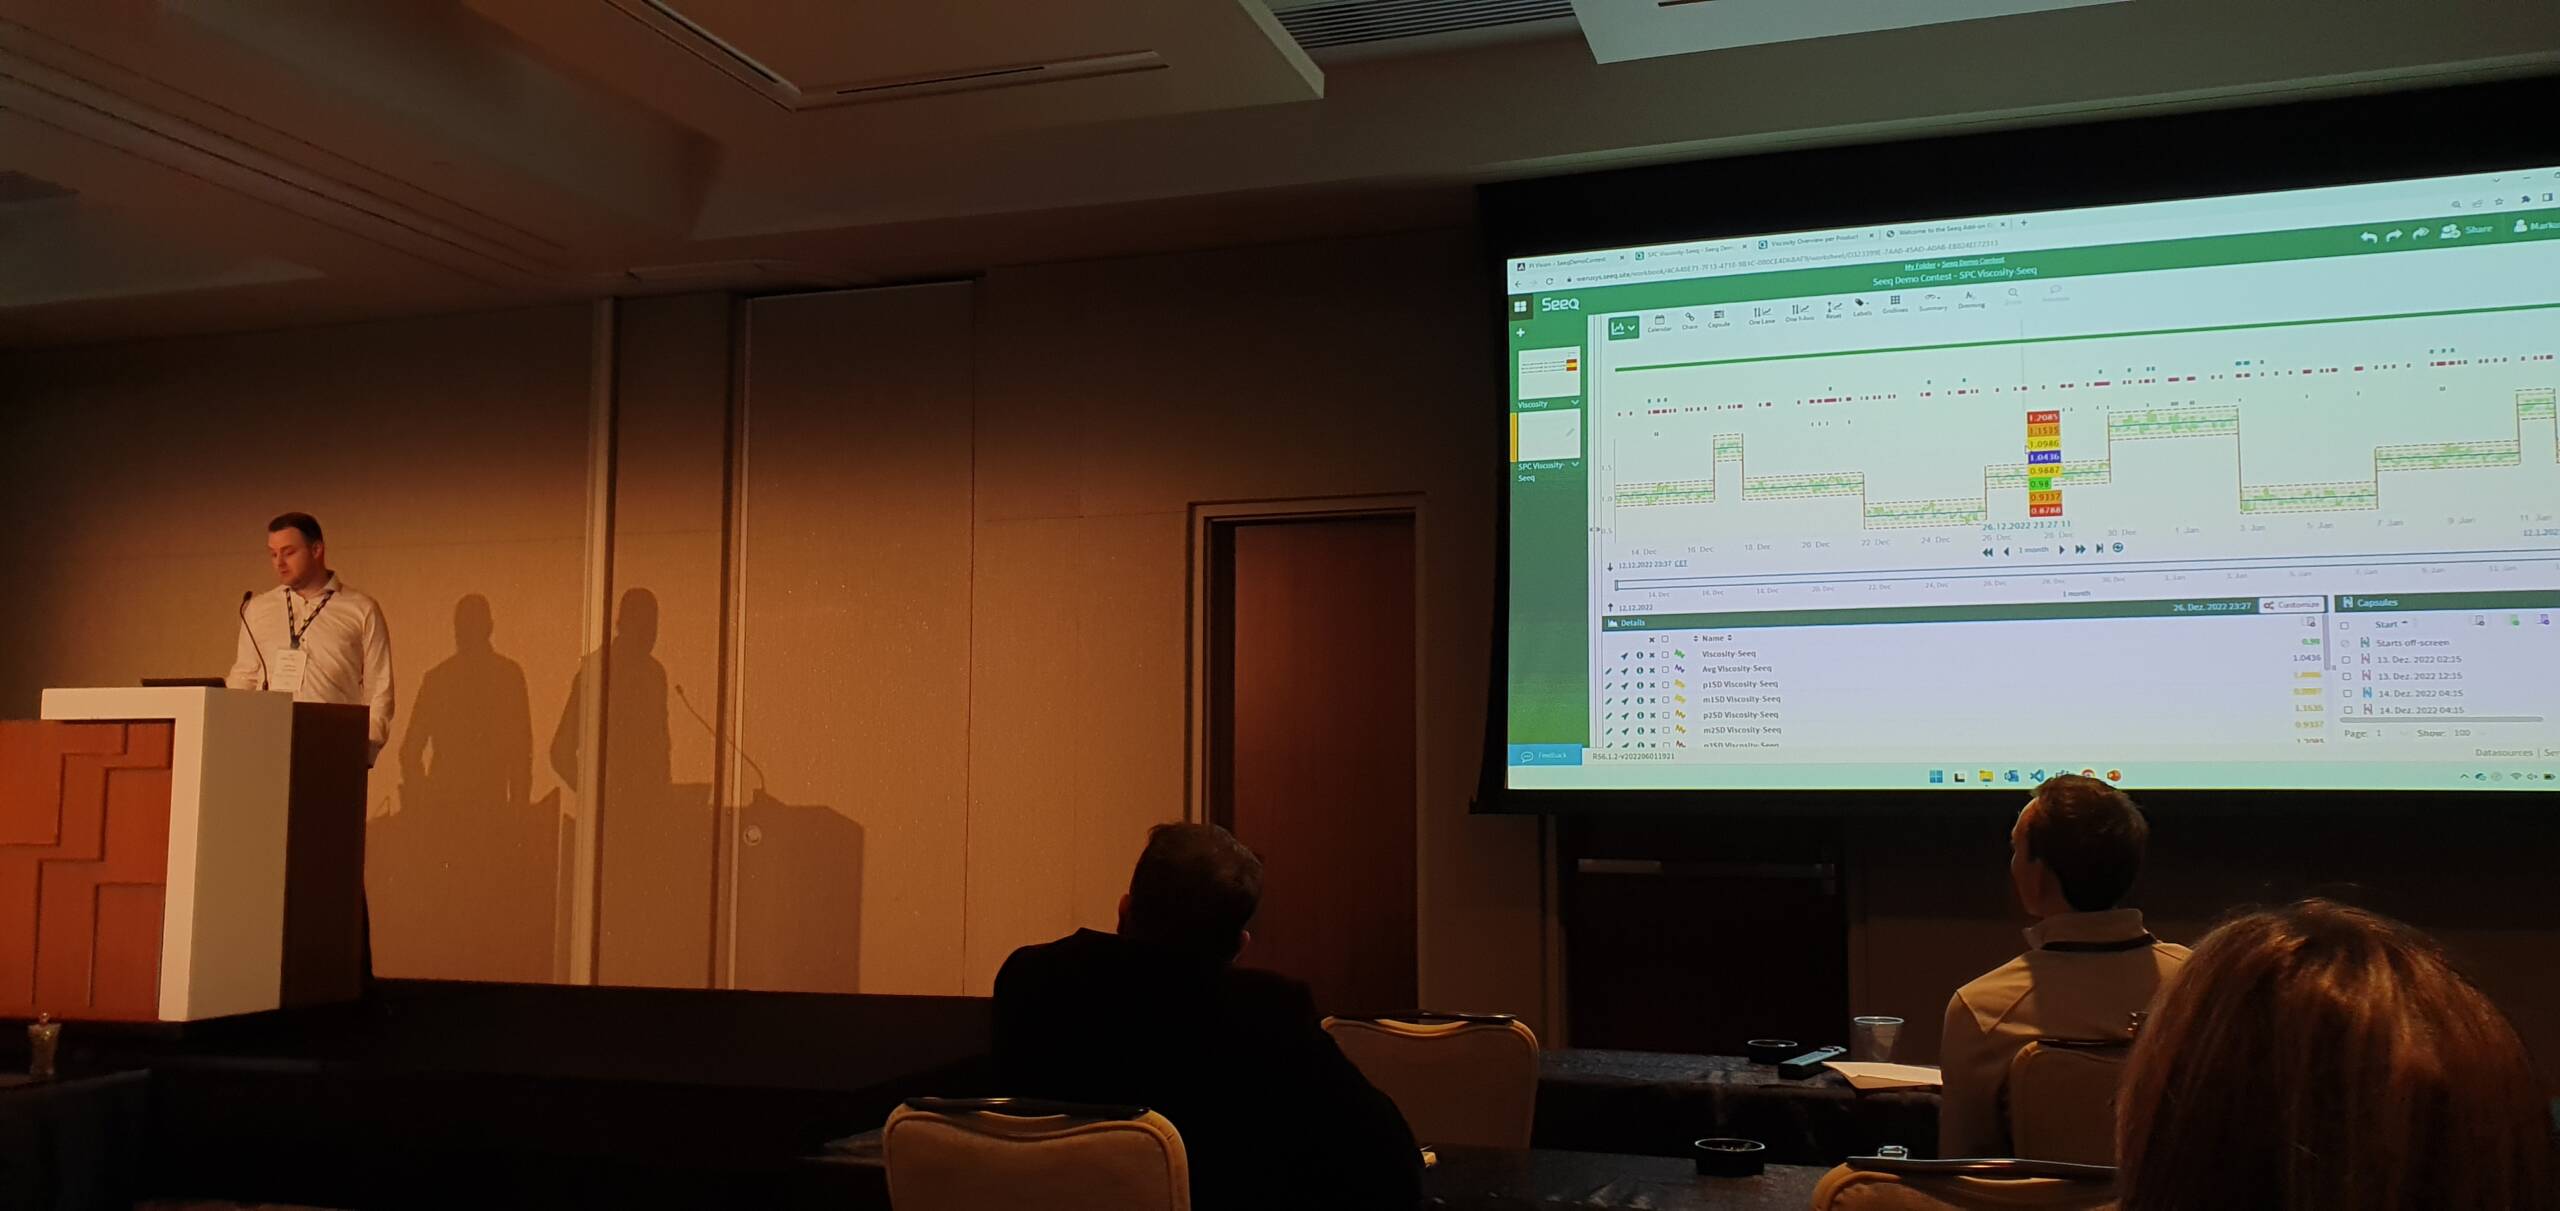
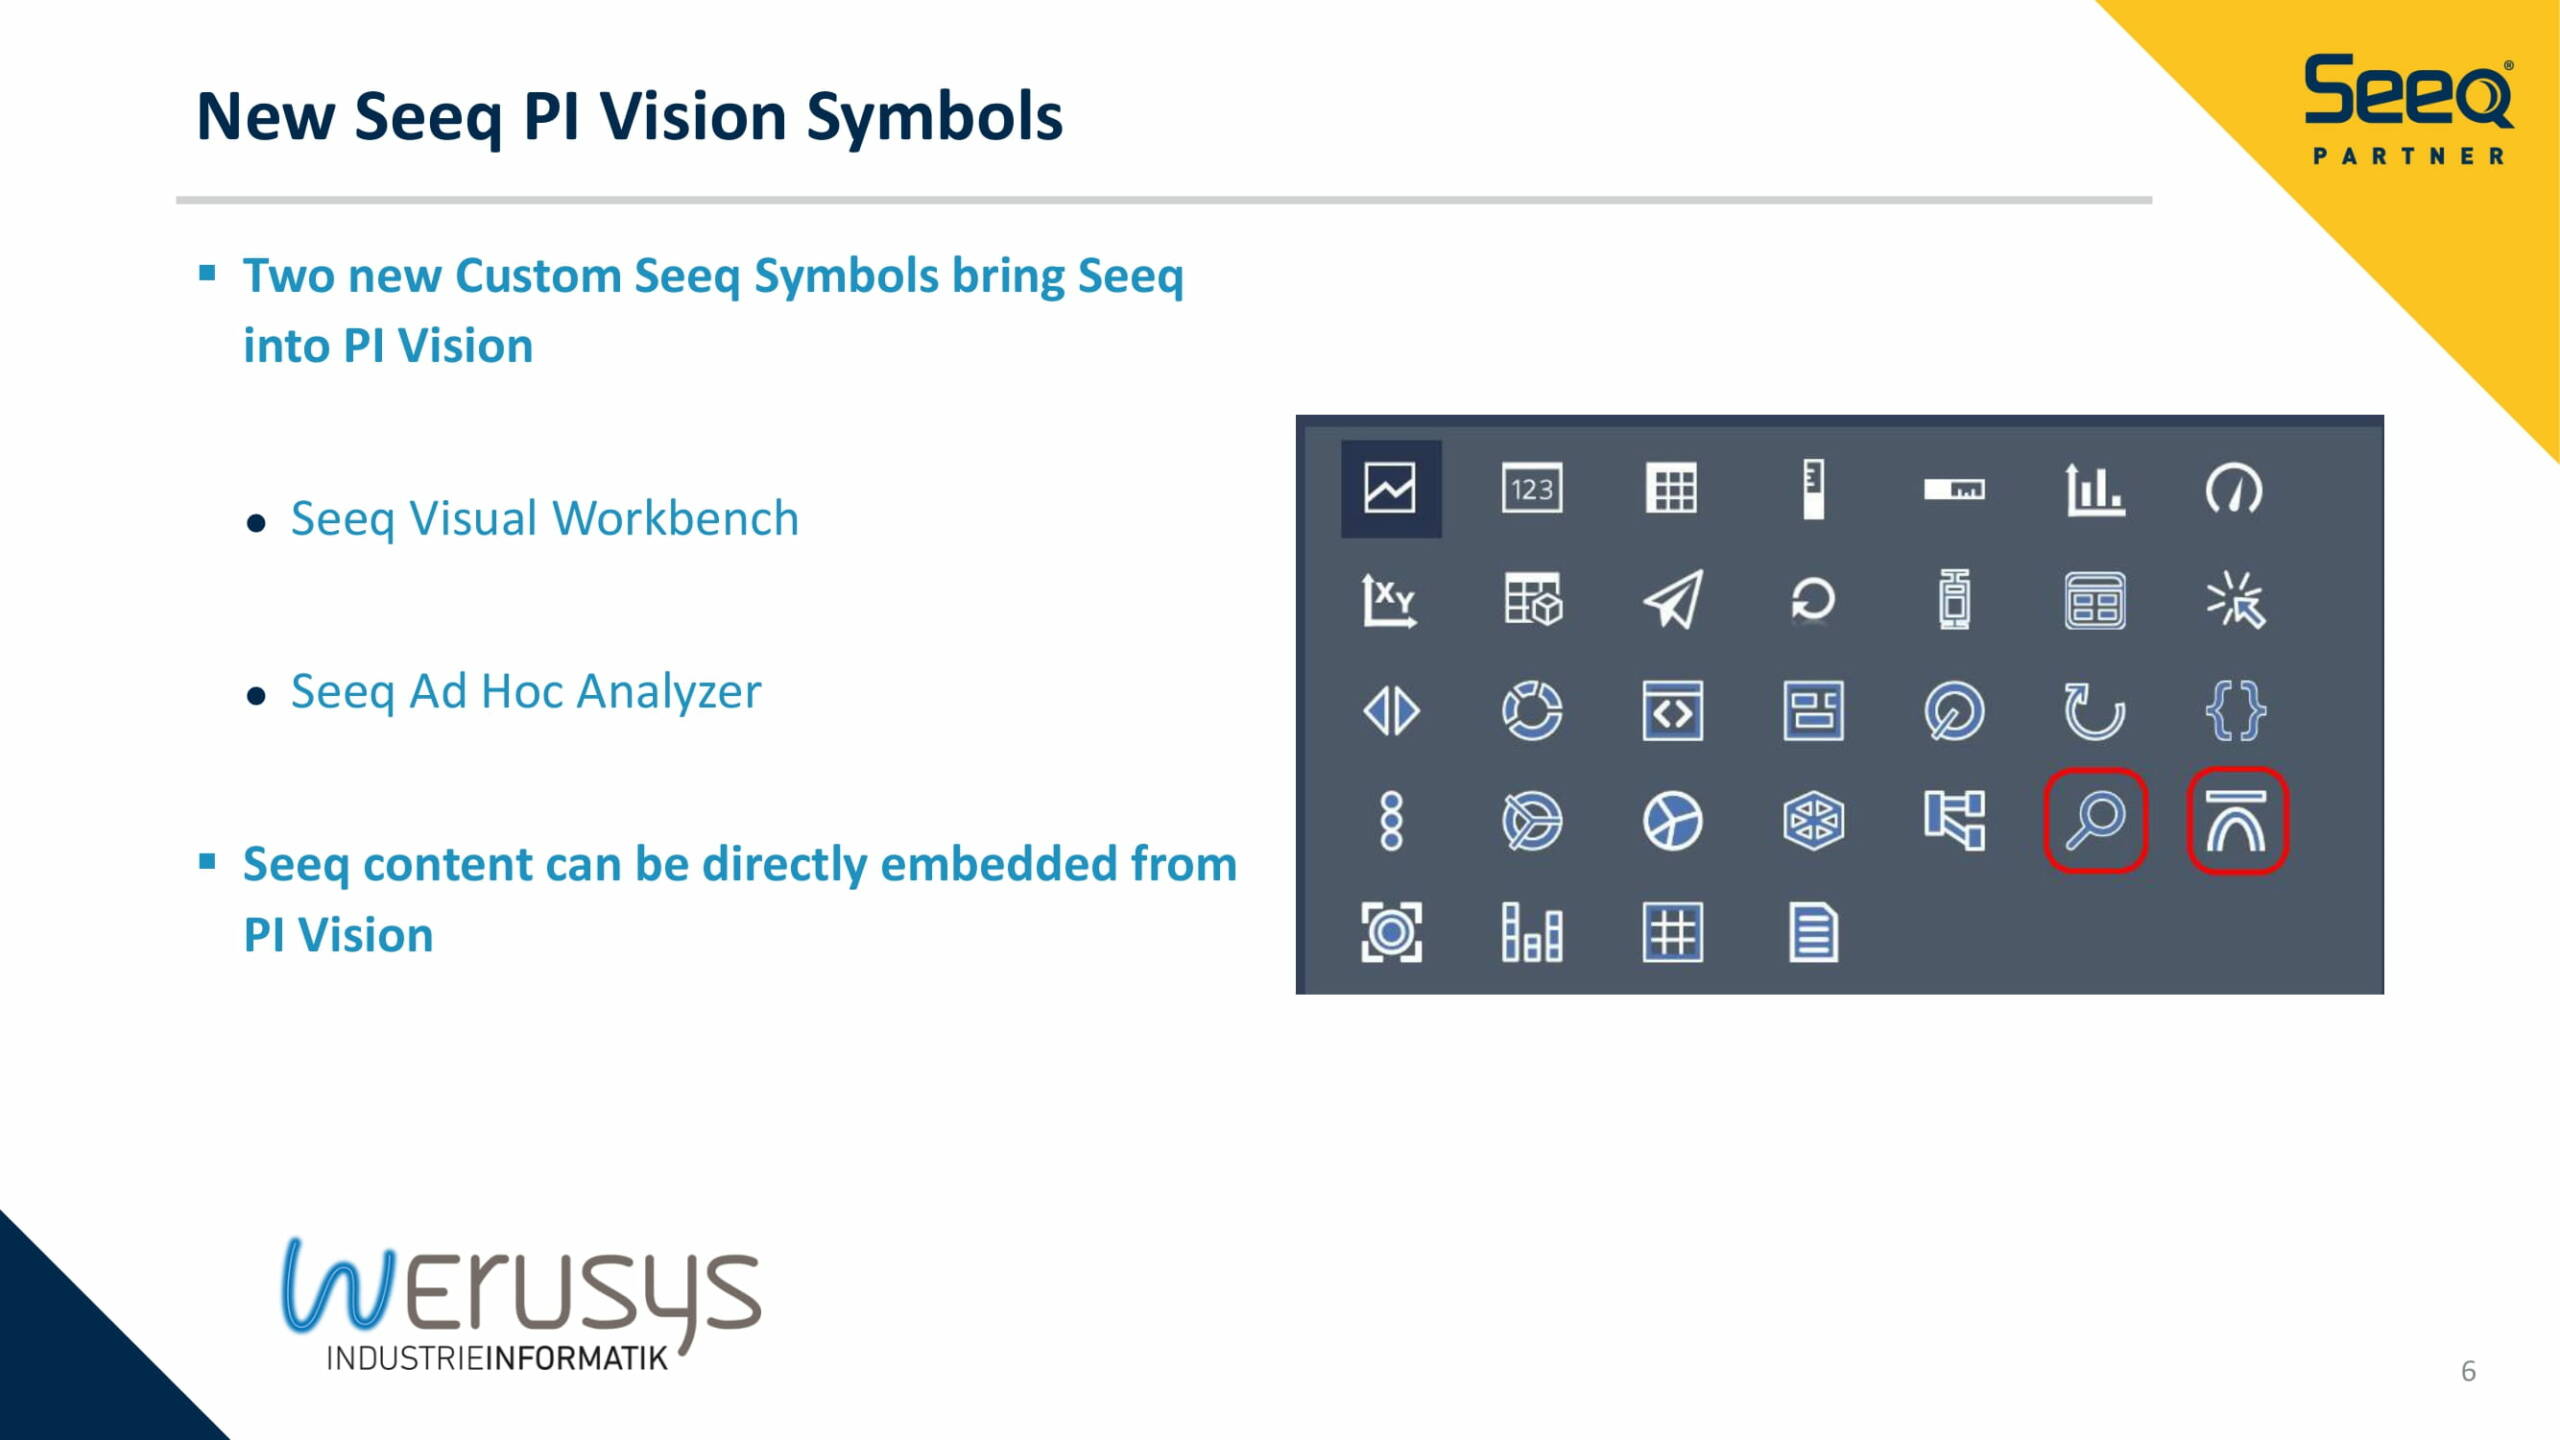
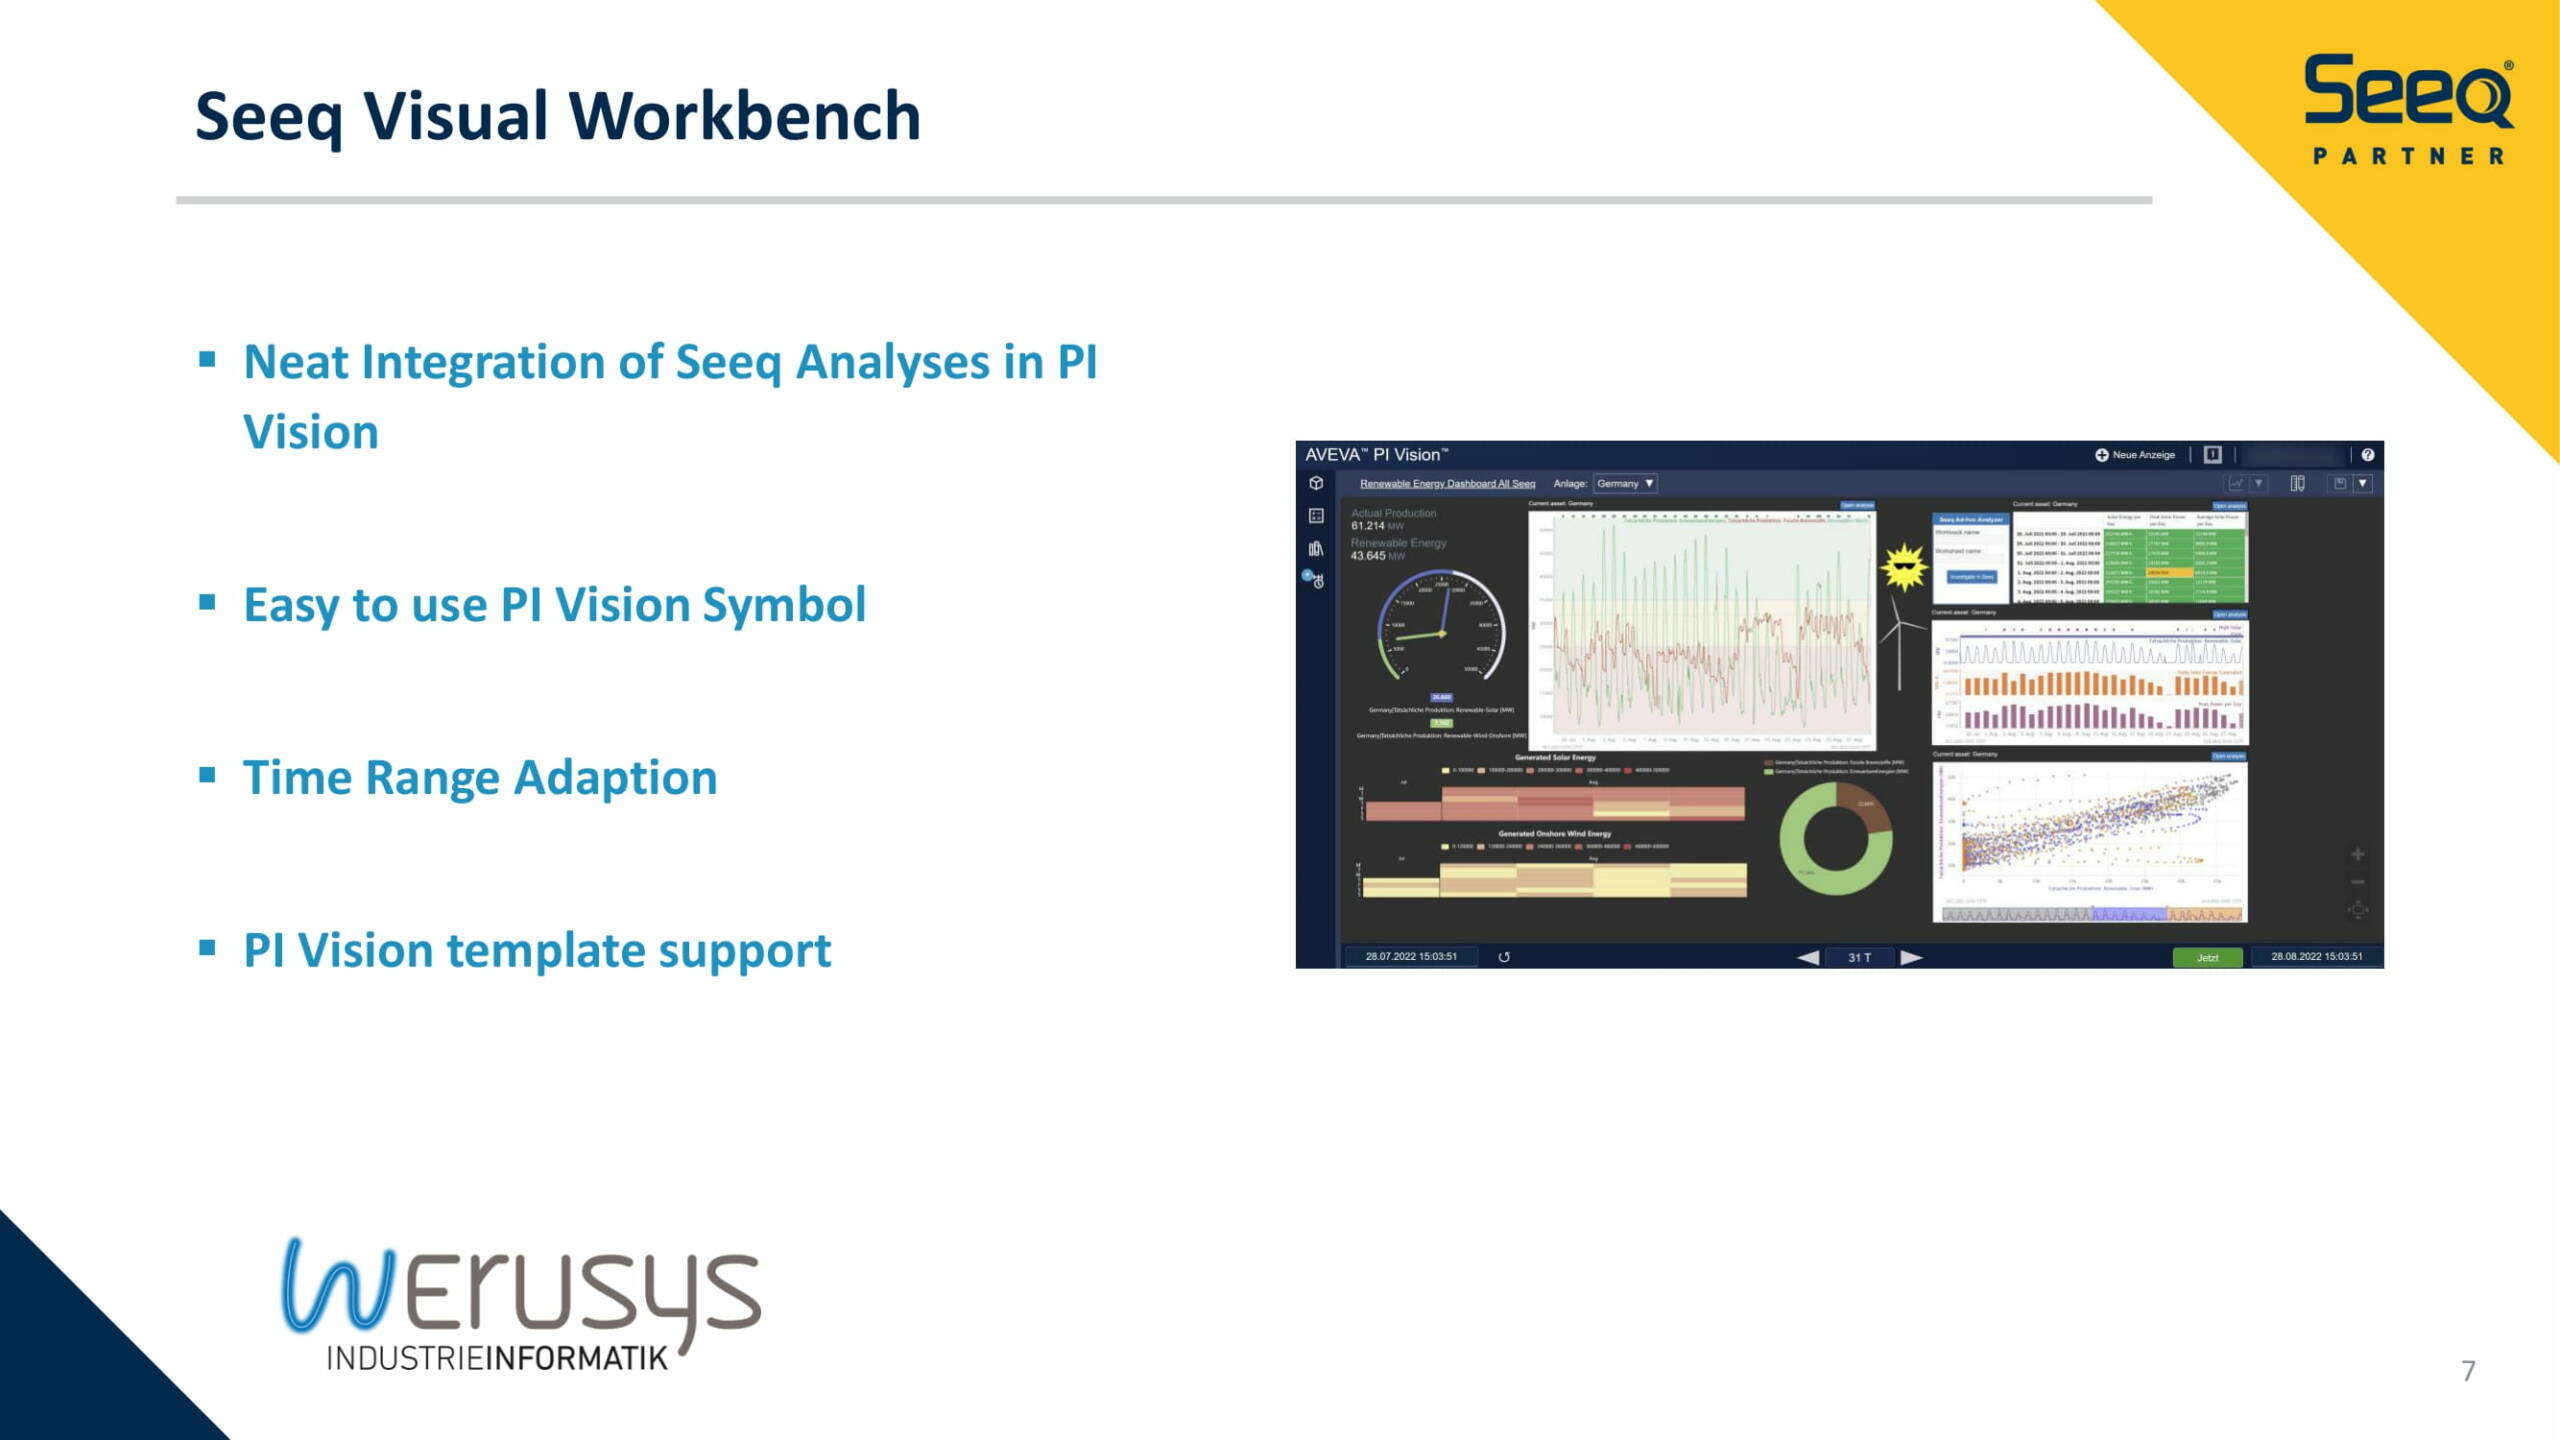
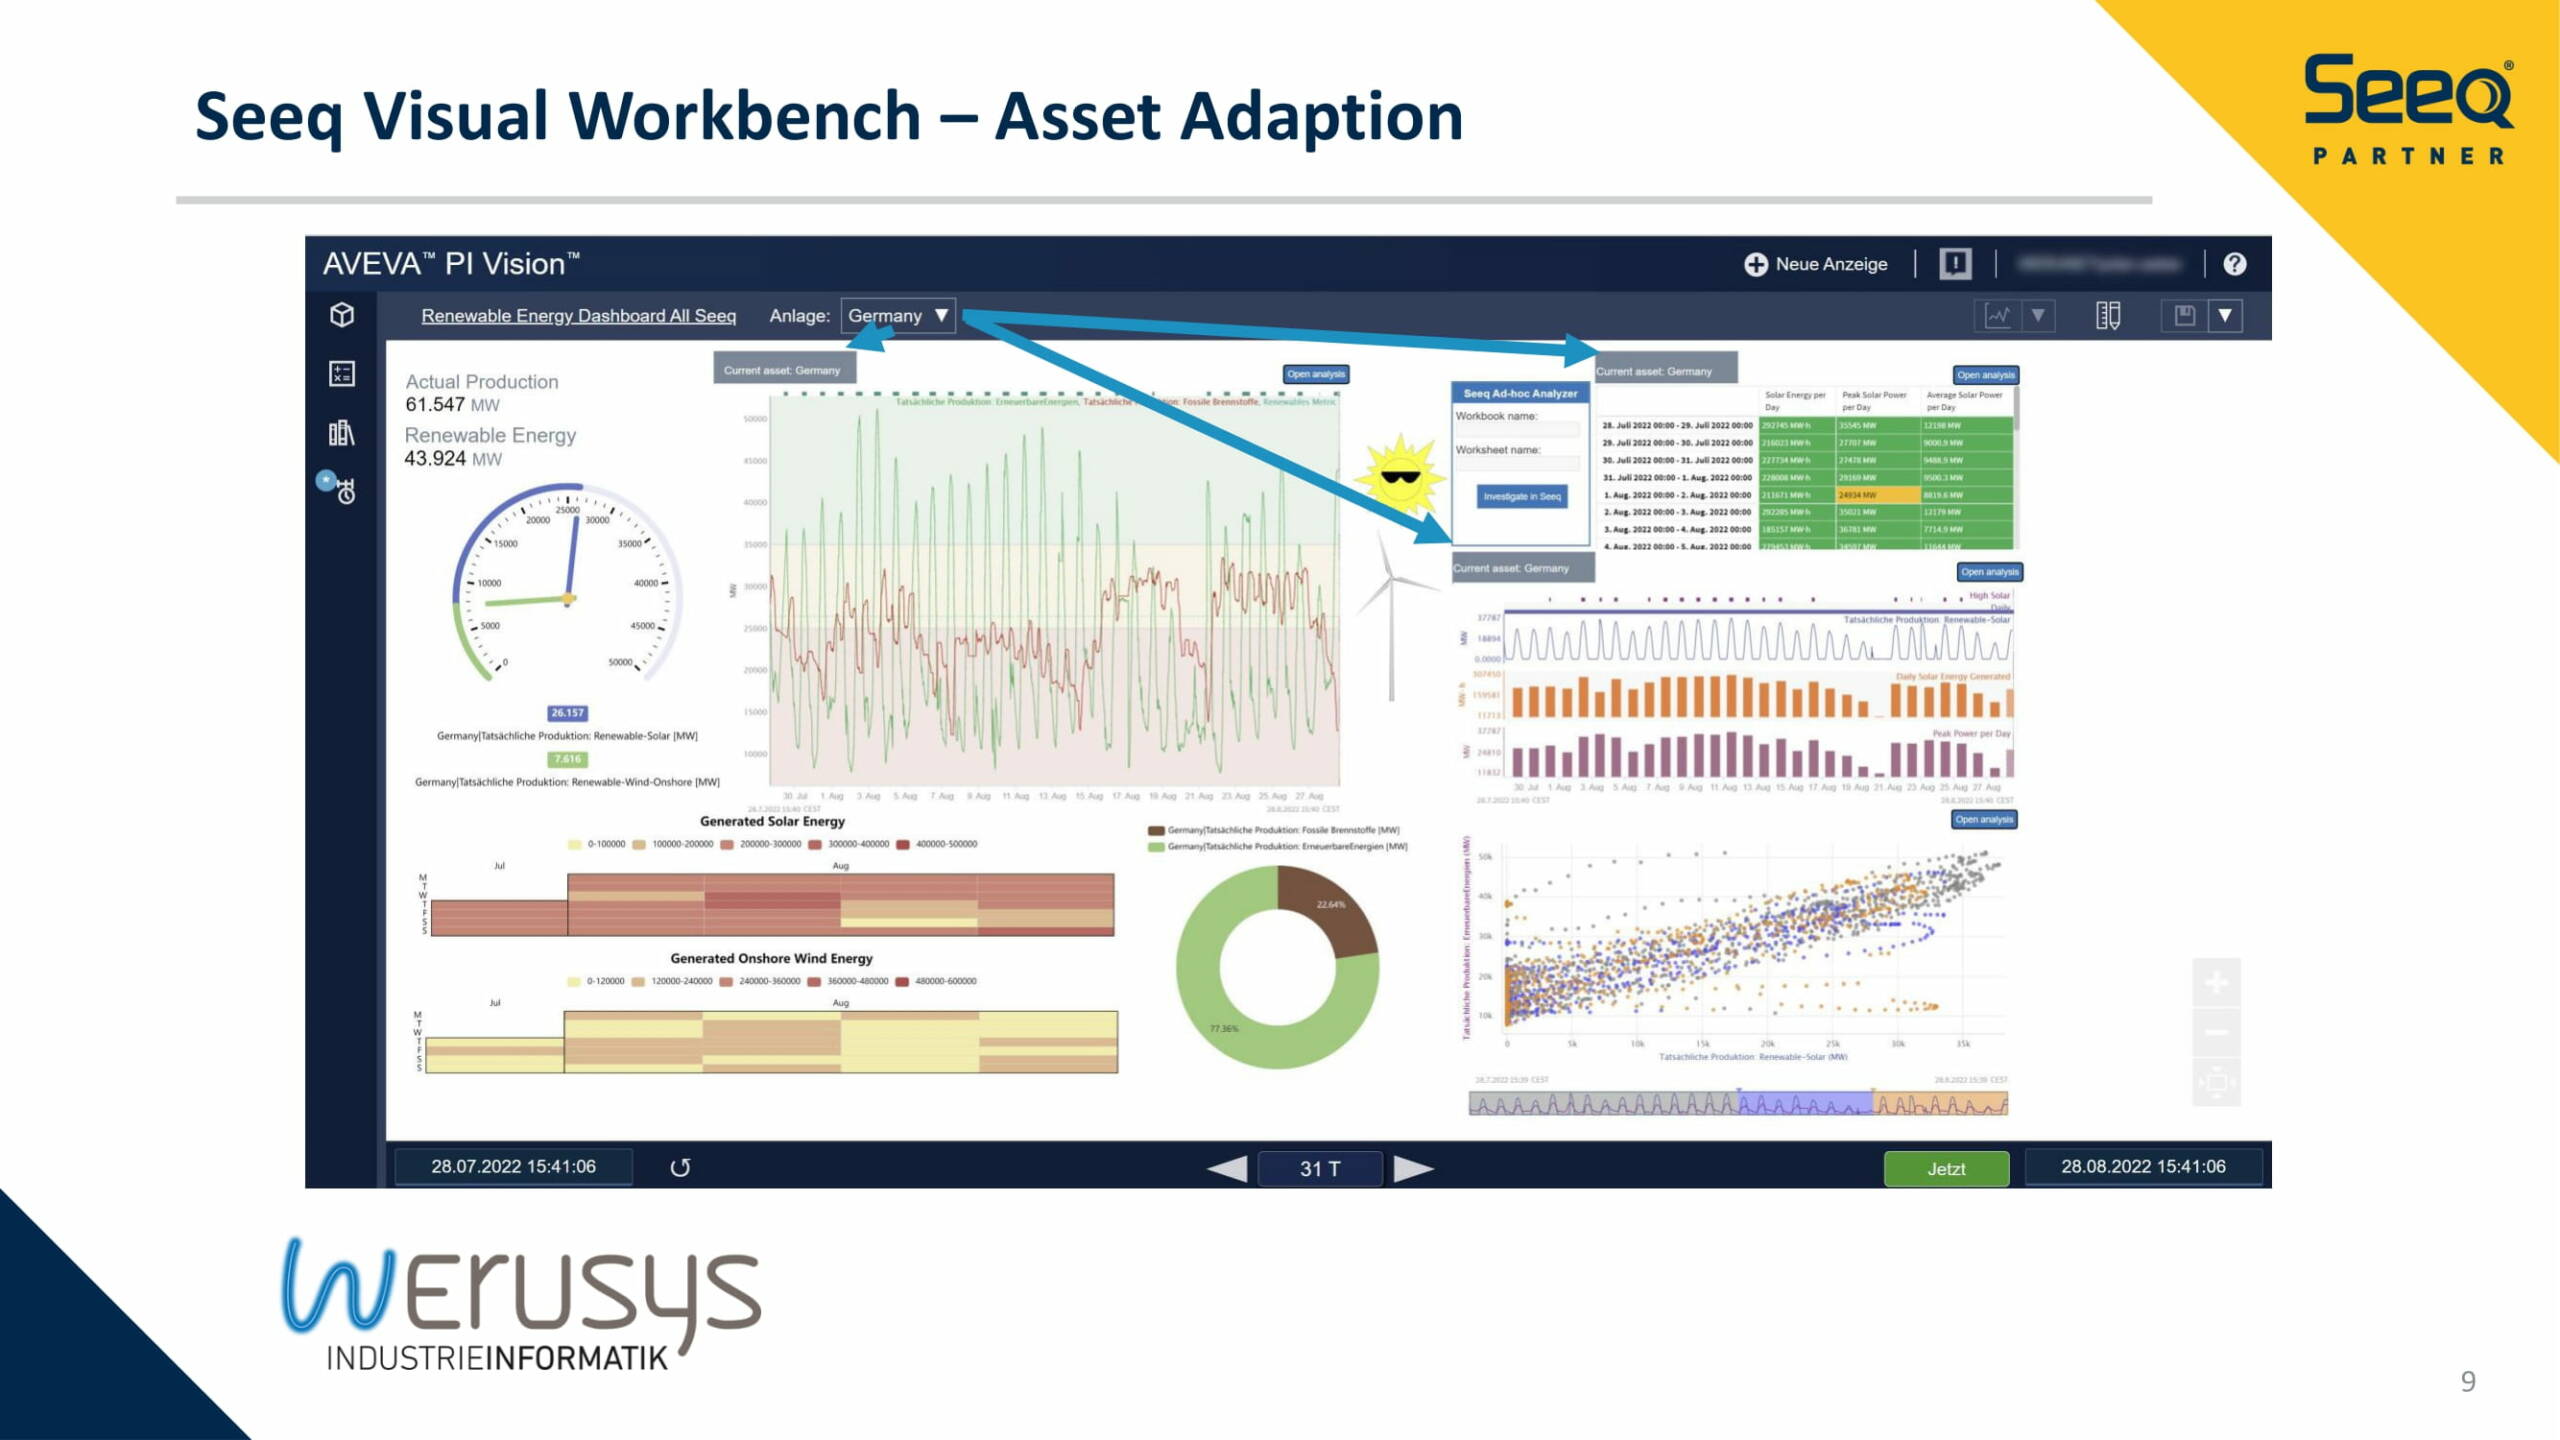
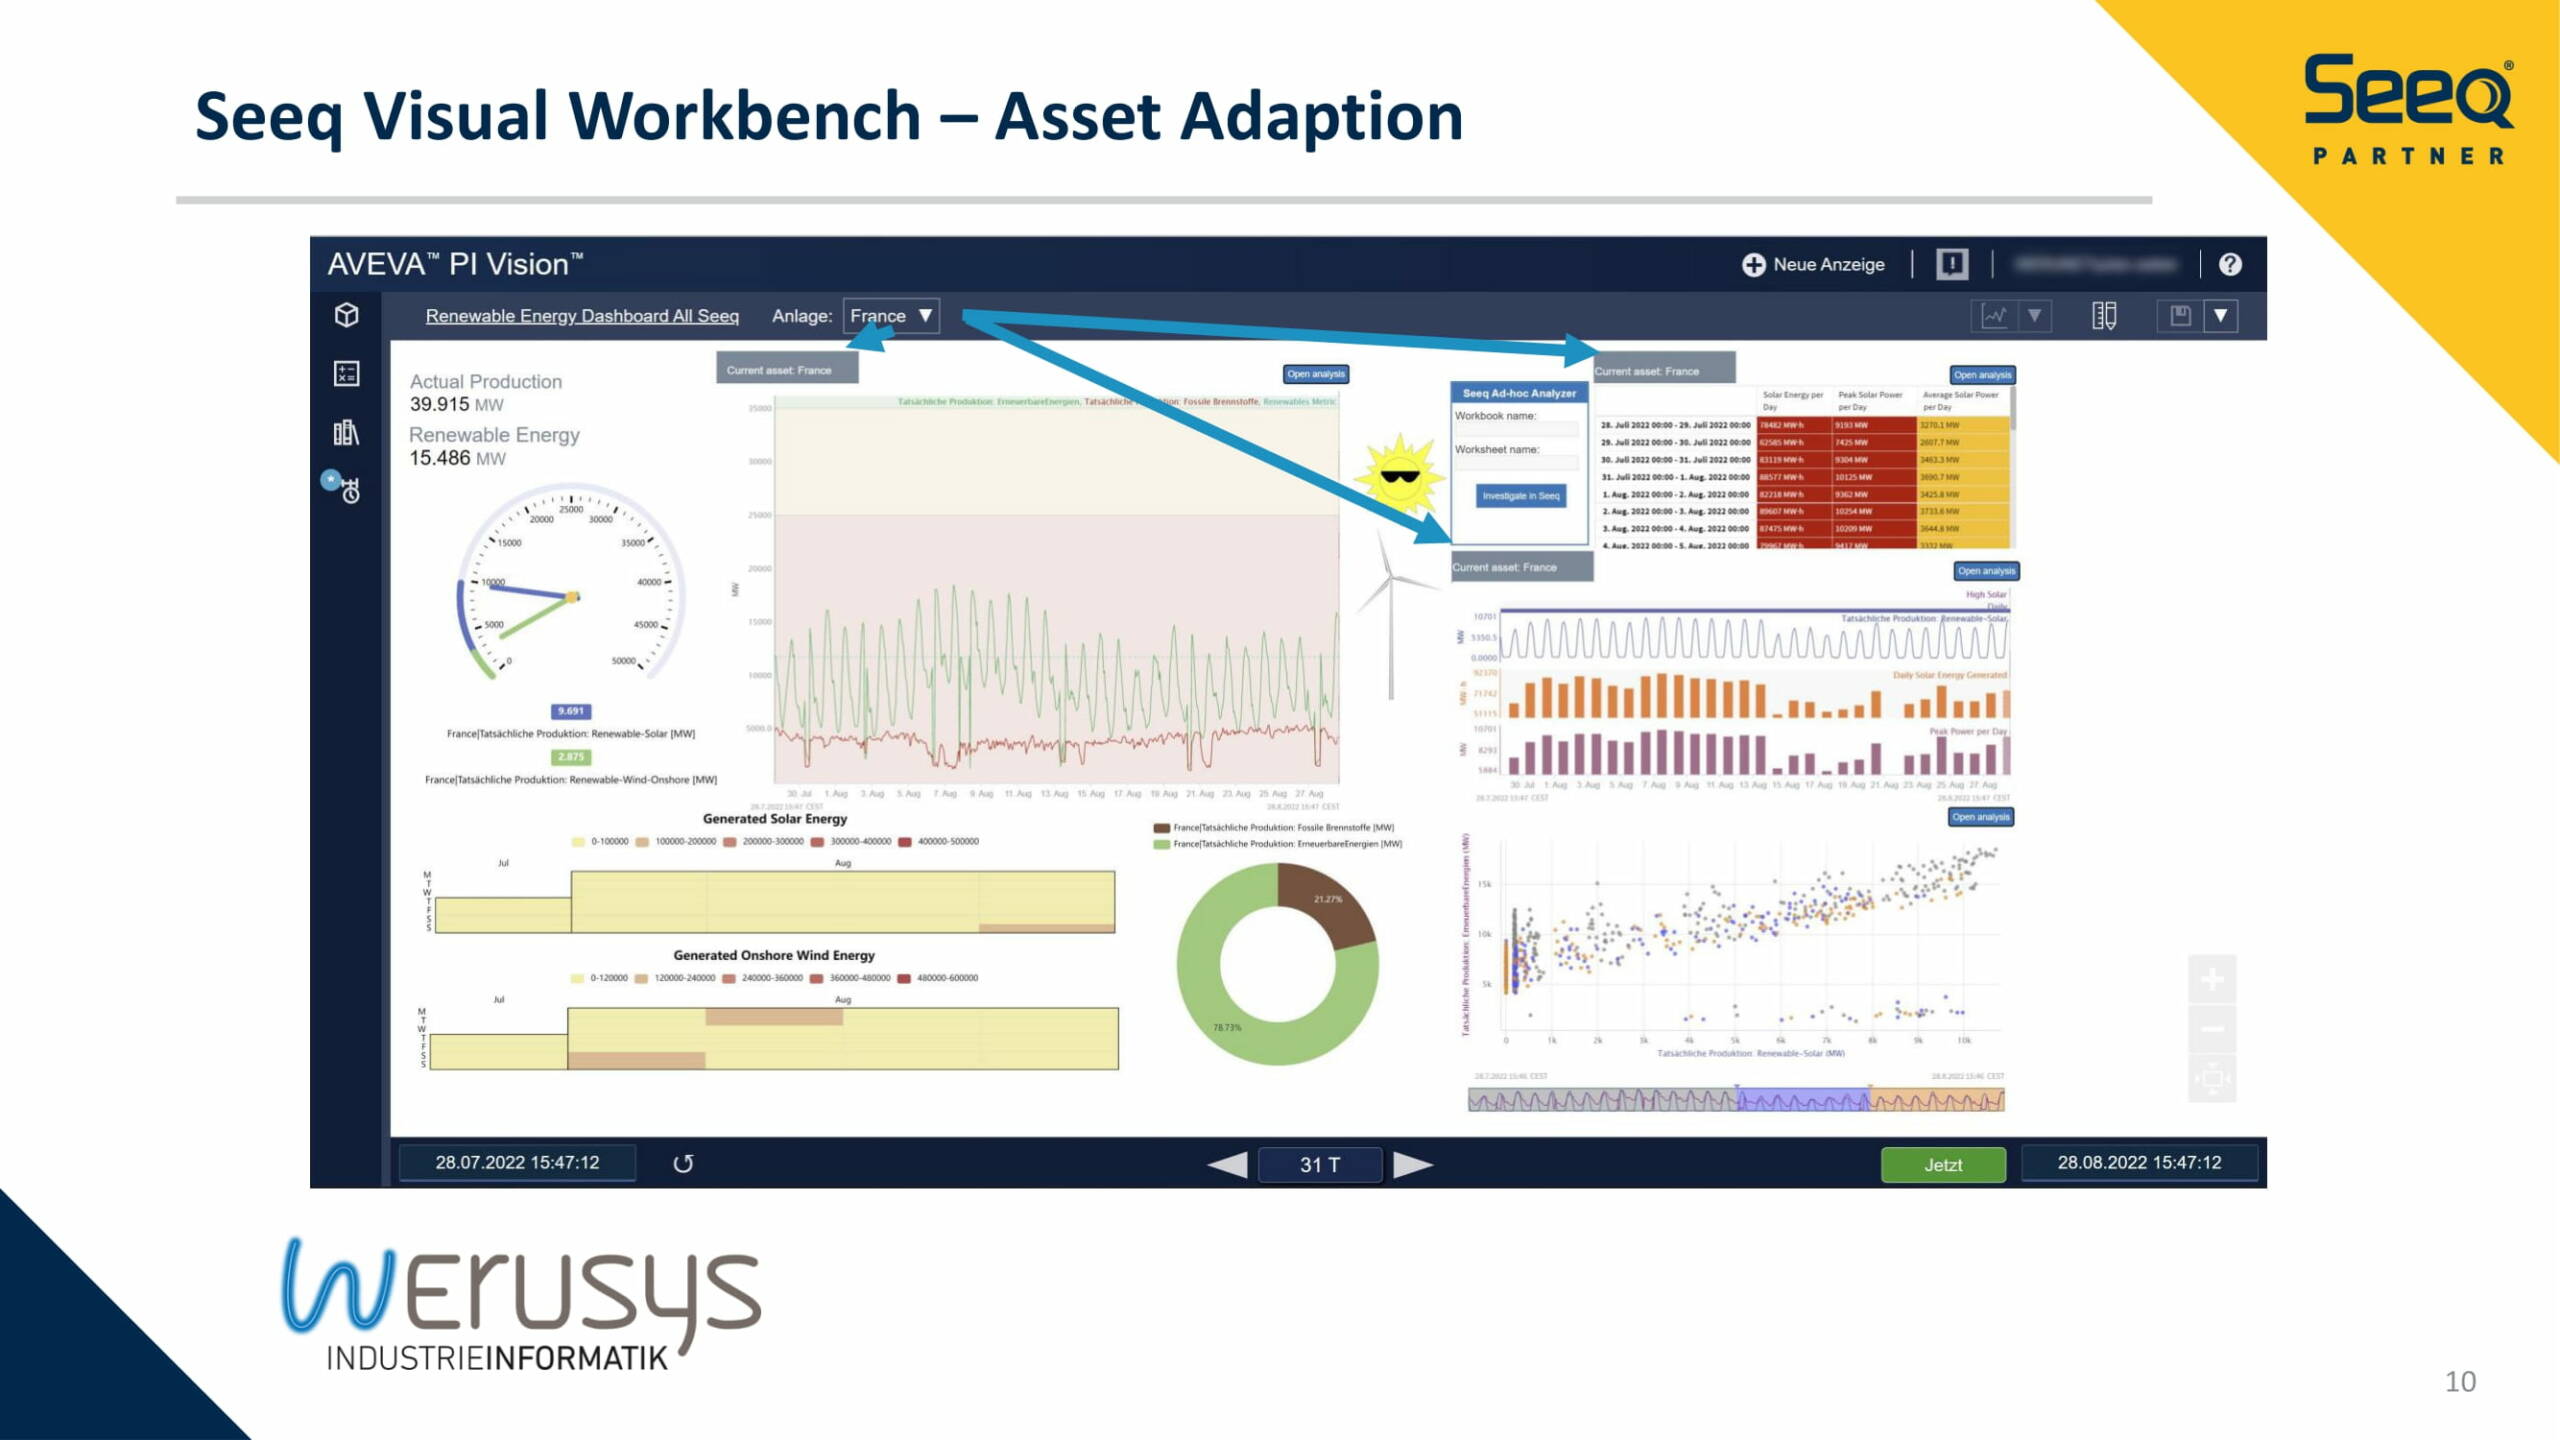
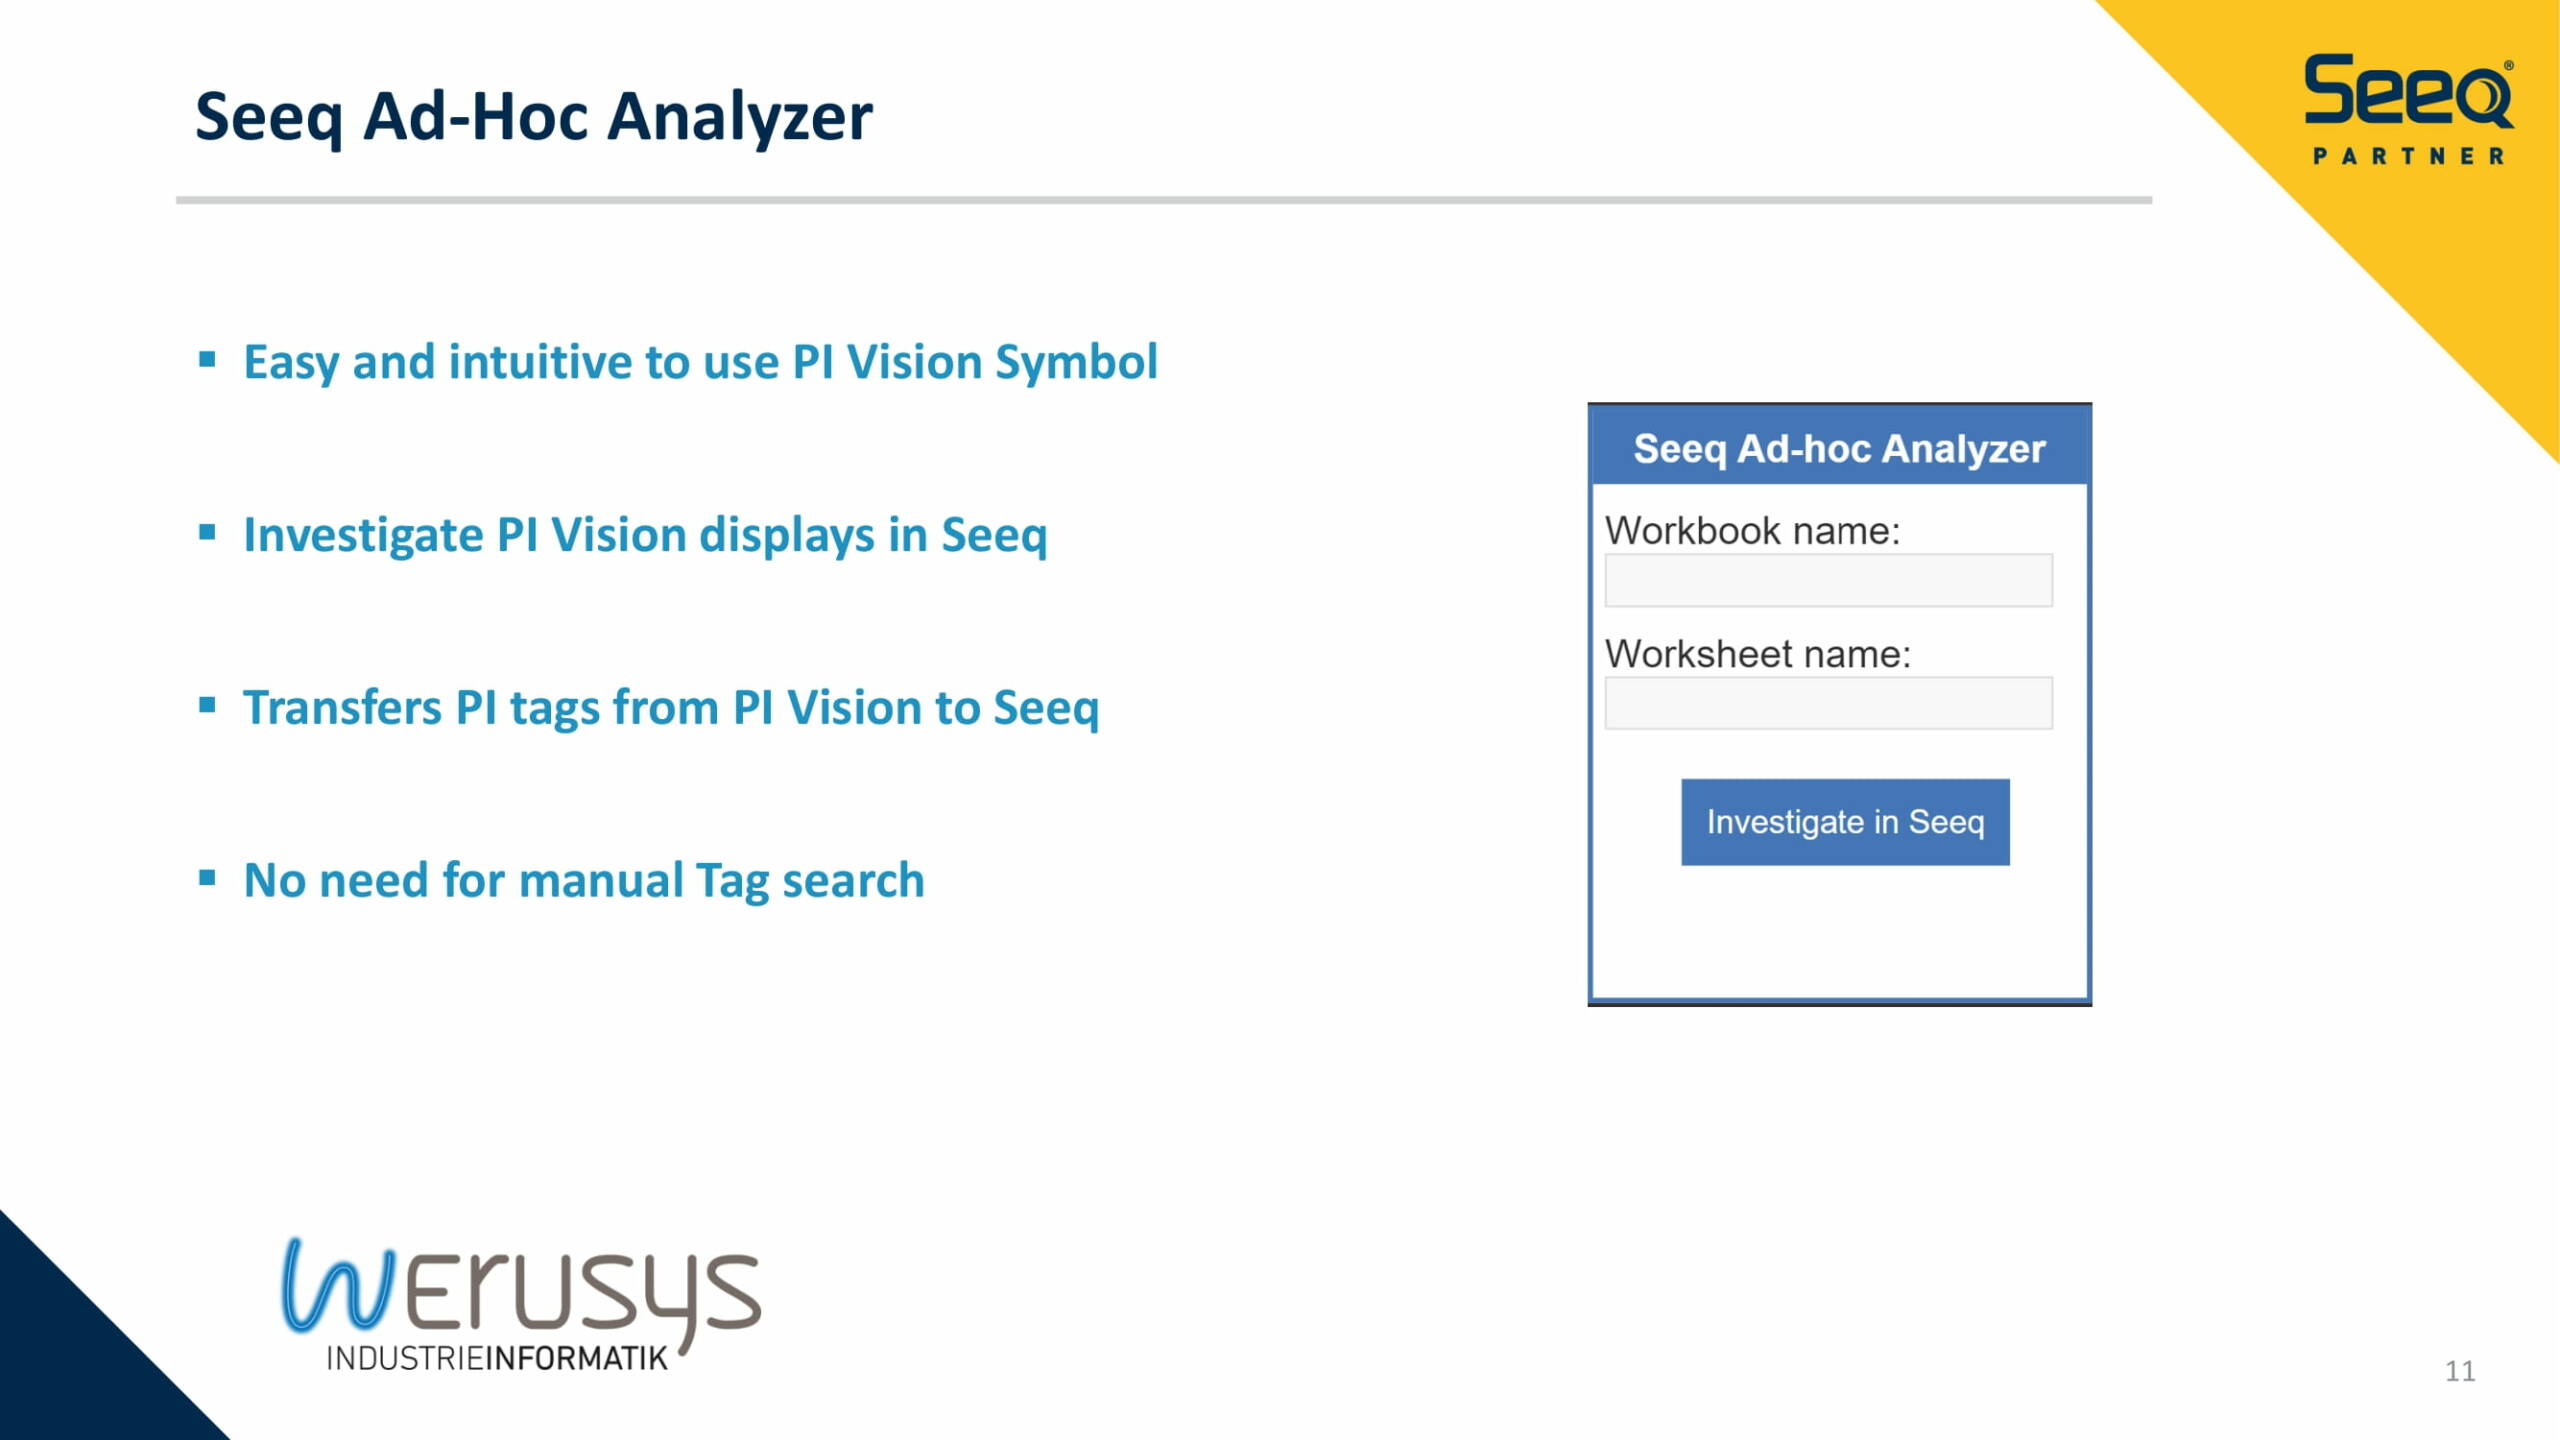
Markus Schimper won the Seeq Demo of the Year Award in Las Vegas for demonstrating how to use Seeq software for Statistical Process Control (SPC) monitoring, and then integrating the analytic results into Aveva PI Vision. The used SPC Add-On was developed by Werusys, a Seeq partner for the DACH region, which includes Germany, Austria, and Switzerland.
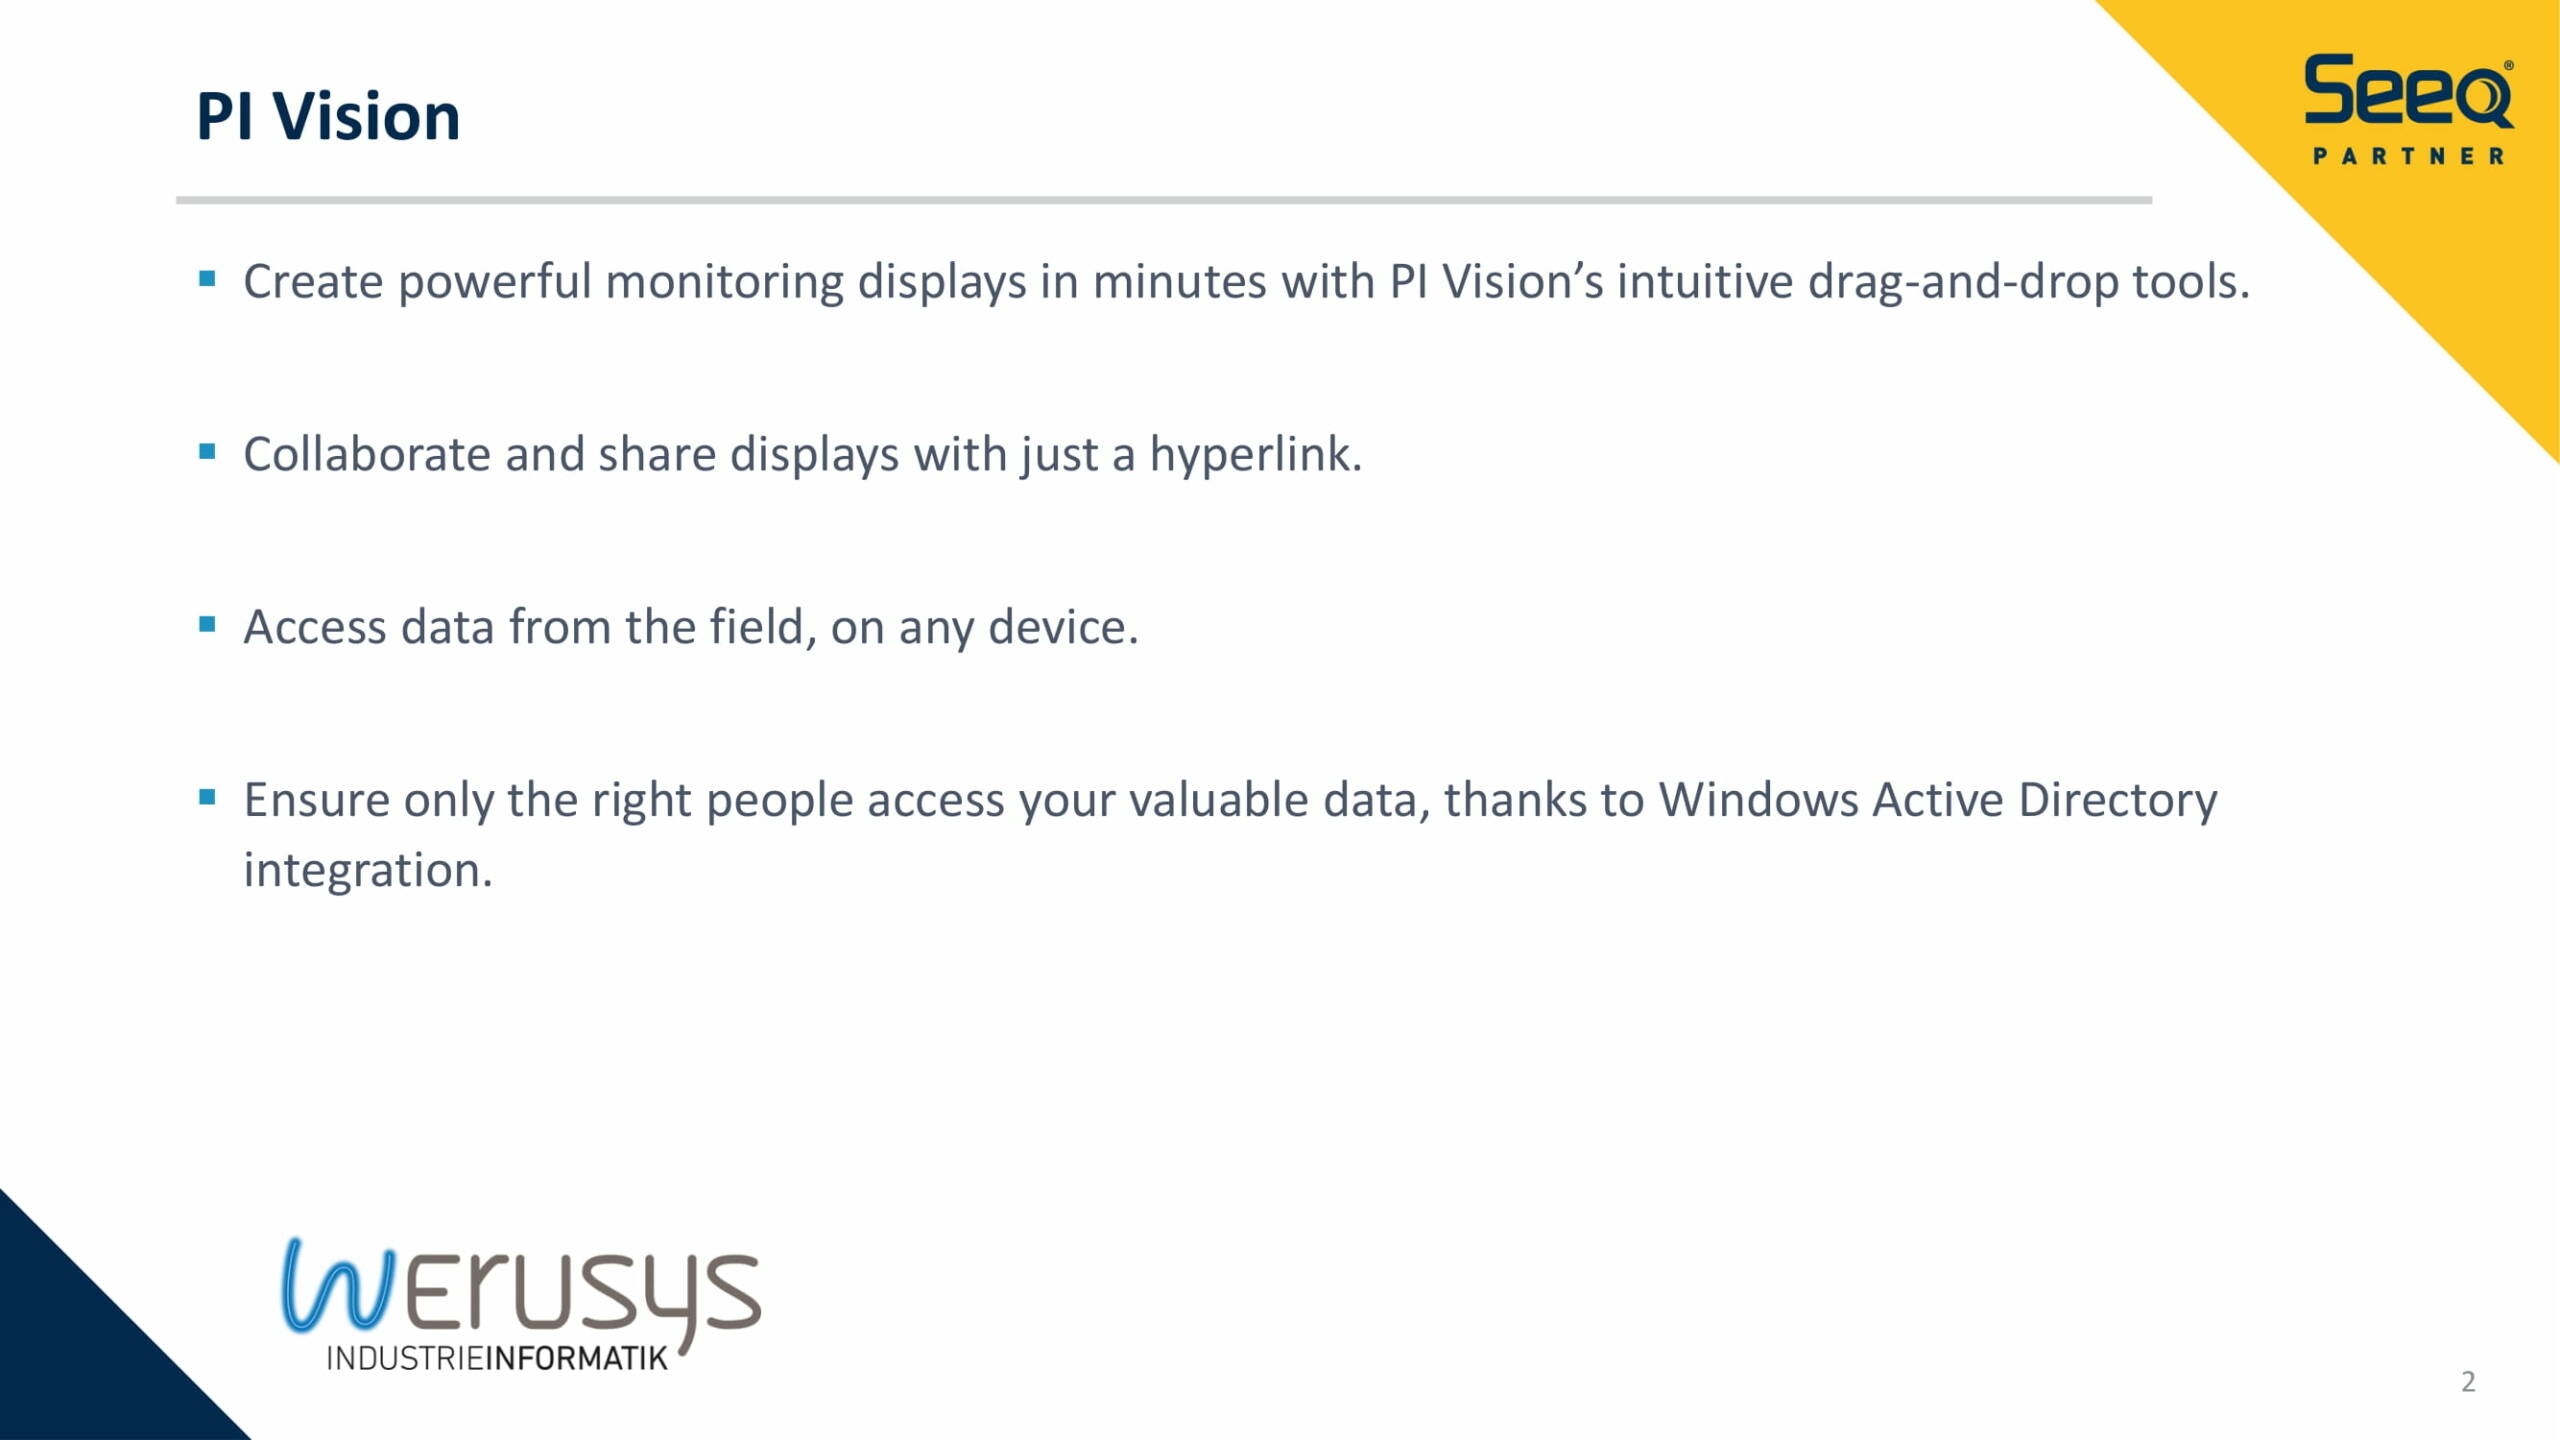
It is a good example of how Seeq software can be used to improve the performance of a manufacturing process by monitoring key performance indicators in real-time and making data-driven decisions to reduce costs, improve efficiency, and increase quality. And also shows how the integration with other tools like Aveva PI Vision can provide a comprehensive view of the process and help to make better decision.
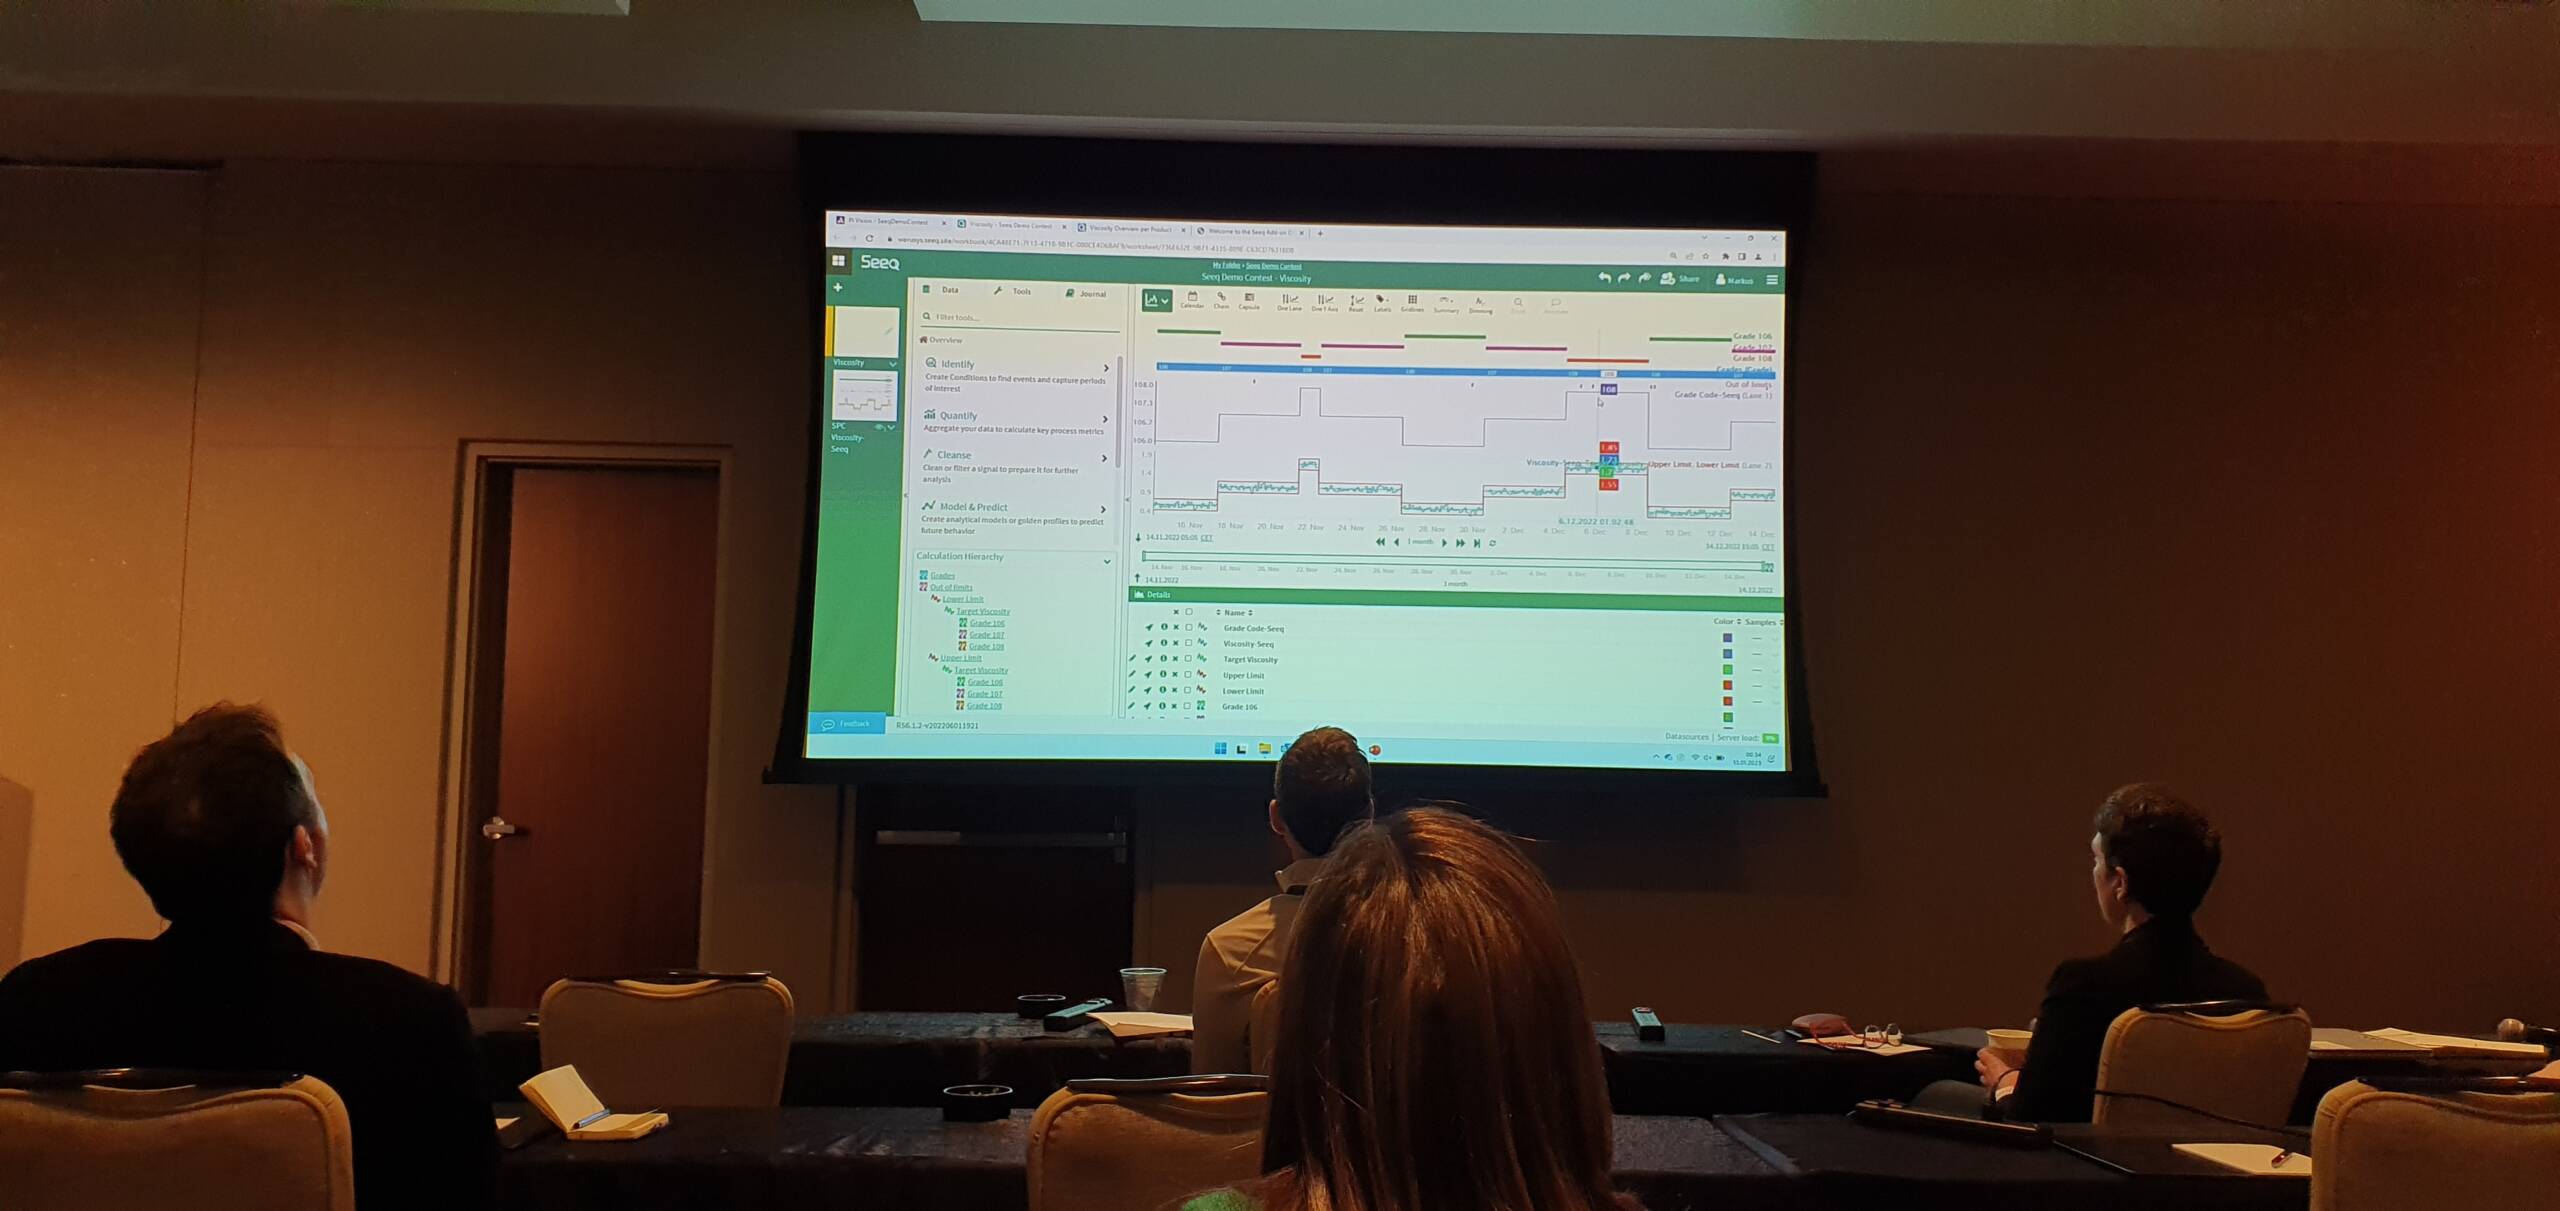
Statistical Process Control (SPC) can be applied to time series data, which is data that is collected over time. In this context, SPC is used to monitor the performance of a process over time to detect trends or patterns in the data that may indicate that the process is not in control. One of the most common tools used in SPC for time series data is the control chart. Control charts are graphical representations of a process that allow you to track the performance of the process over time and identify when the process is not in control. Typically, control charts include a centerline that represents the average value of the process, and upper and lower control limits that indicate when the process is out of control.

When using control charts for time series data, the data is typically plotted on the chart over time, with each data point corresponding to a specific time or time period. This allows you to see how the process is performing over time and detect patterns or trends in the data that may indicate that the process is not in control. In addition to control charts, other statistical tools such as trend analysis, forecasting, and statistical process monitoring can also be used to analyze time series data in the context of SPC. These tools can be used to identify patterns and trends in the data and make predictions about future process performance, which can help to improve efficiency, reduce costs, and increase quality.
With his demo, Markus Schimper was able to convince the jury and the audience and thus achieved first place among 10 participants.


Seeq
Accelerated Insights, Improved Outcomes
In the current hype around predictive analytics, machine learning and data science, solutions to the real challenges of an analytics-driven business are missing. Leveraging the expertise of your current workforce. Support for collaboration and knowledge capture to drive sharing and reuse of analytics results. And the ability to quickly share insights with the people who need them to rapidly improve results.
Intuitive. Visual. Innovative.
Seeq is the first application for analyzing process data. Search your data, add context, cleanse, model, find patterns, set boundaries, monitor assets, collaborate in real time, and interact with time series data like never before.
Fast. Flexible. Collaborative.
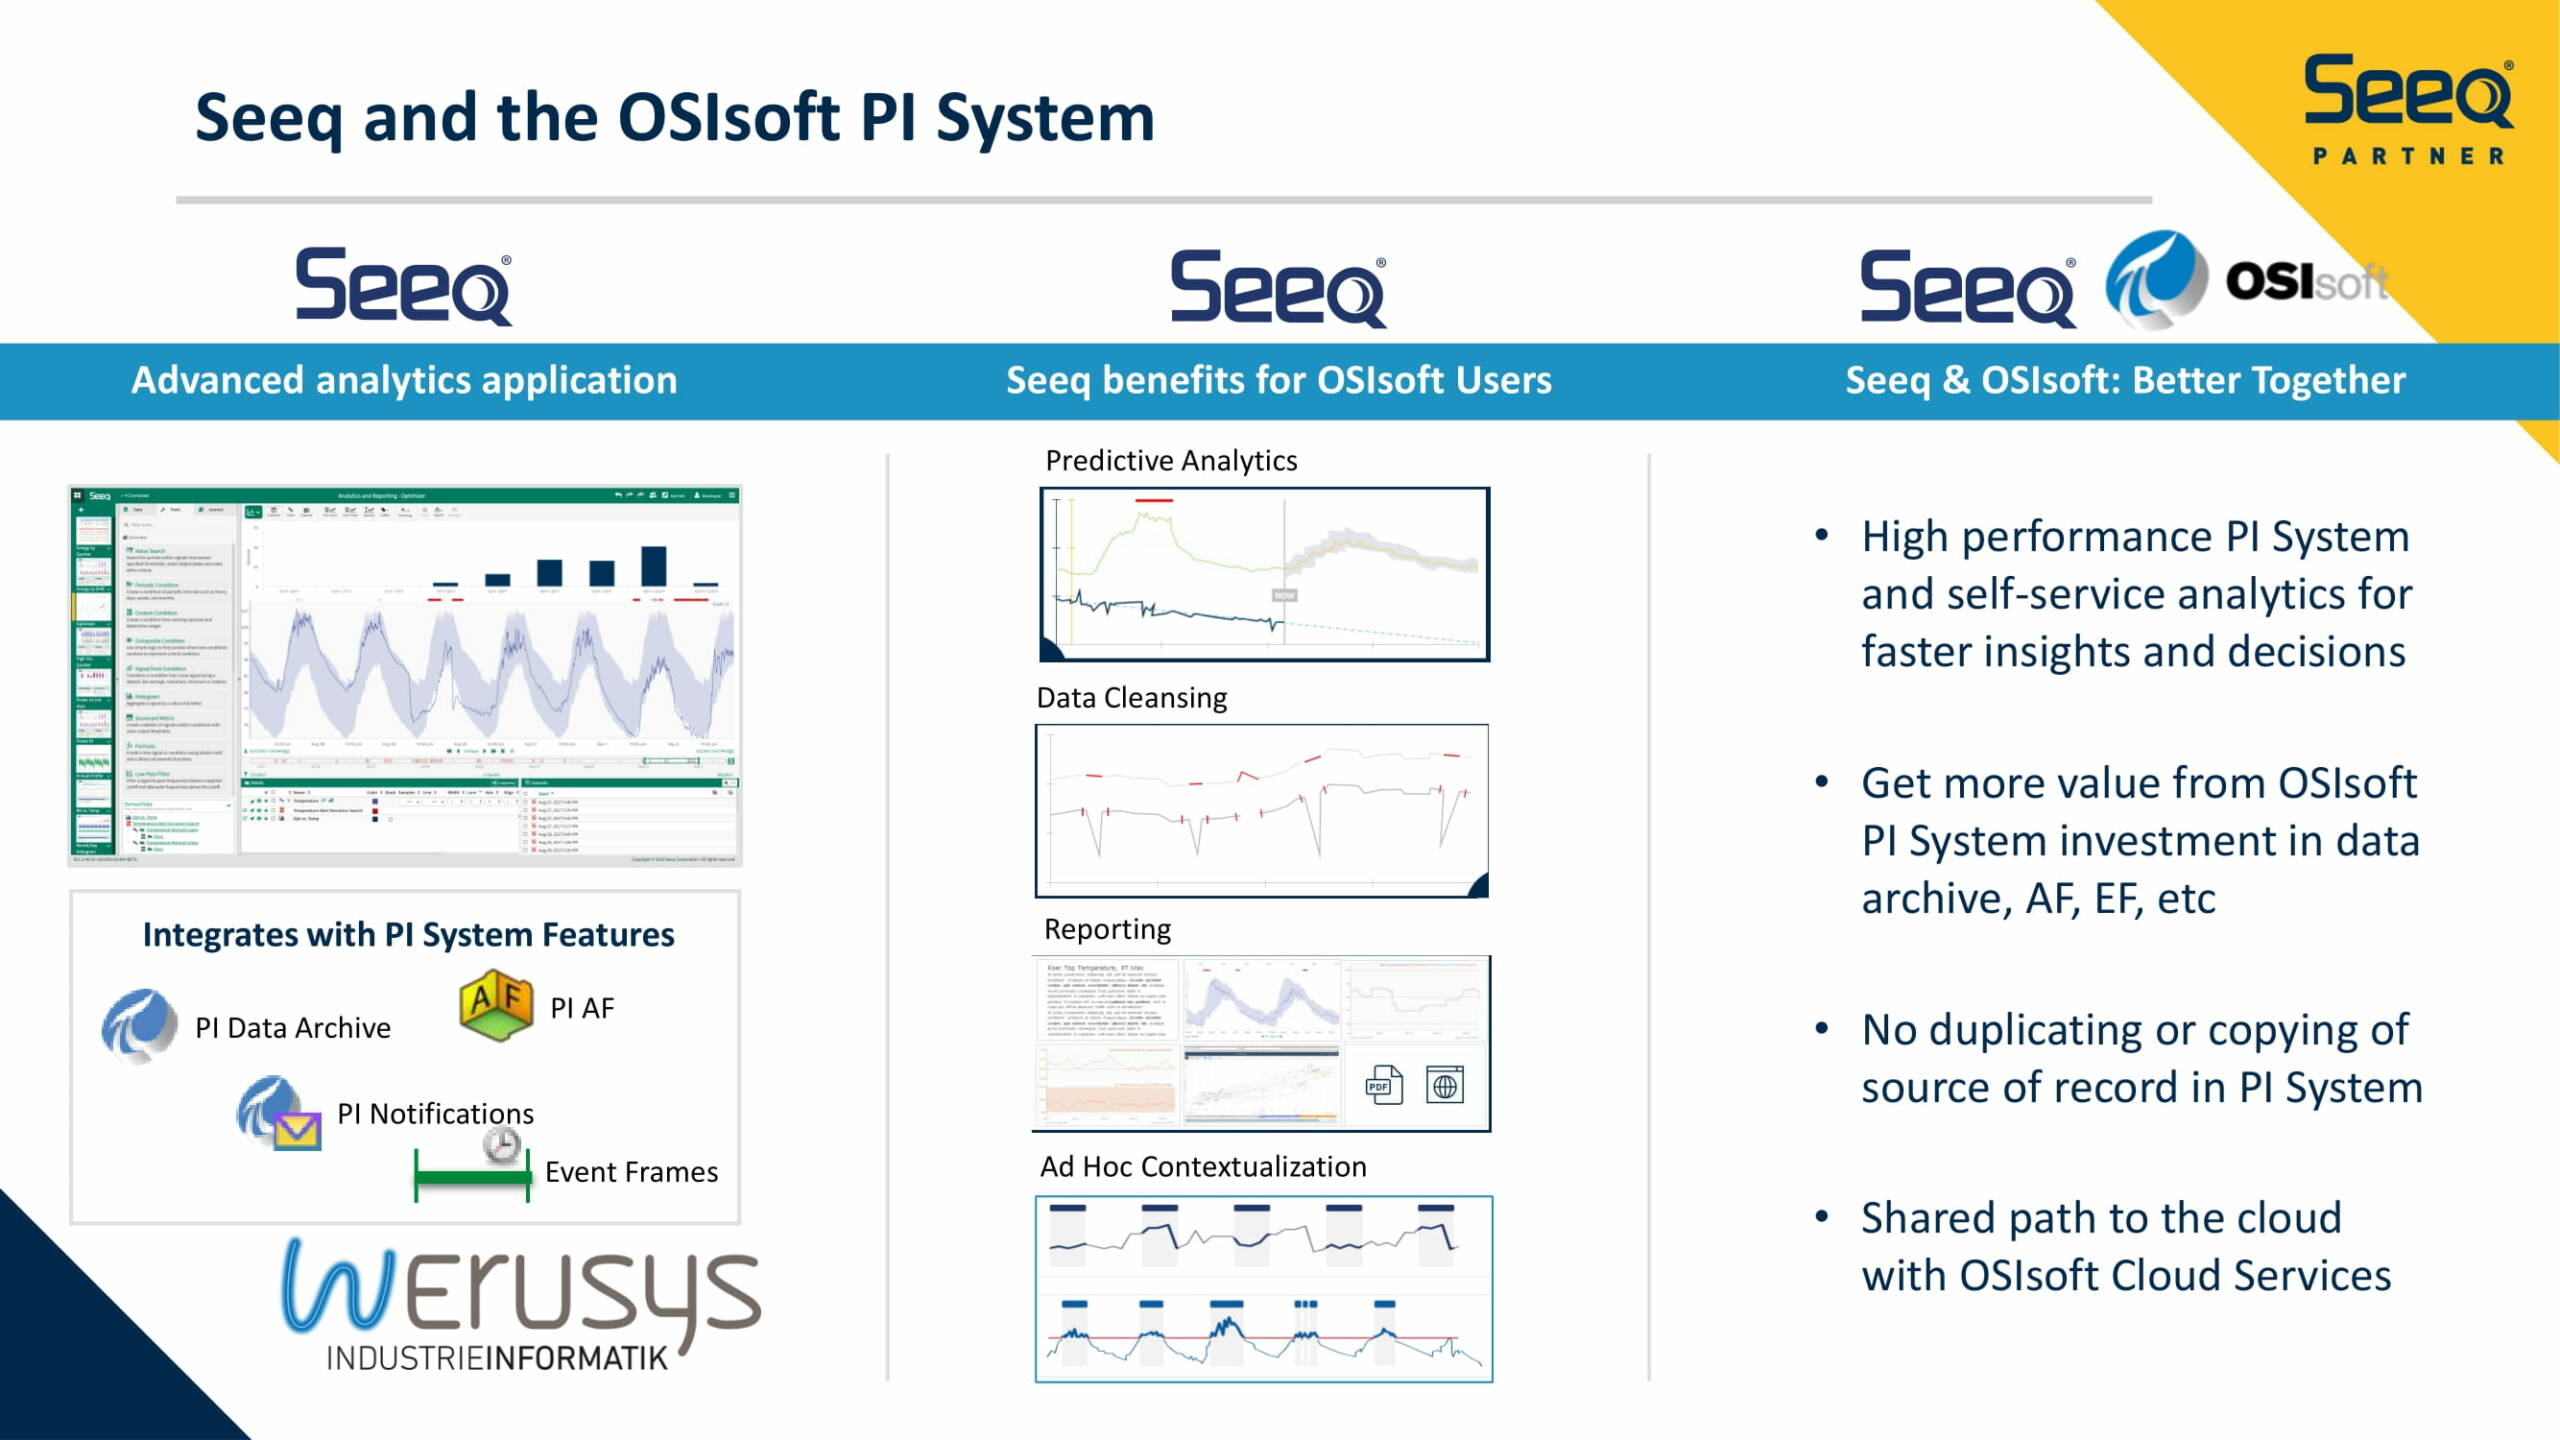
No matter what process historian or plant data system you use – OSIsoft® PI System®, Honeywell’s Uniformance® PHD, Emerson DeltaV and Ovation, Inductive Automation’s Ignition, AspenTech IP.21, Wonderware, GE Proficy or another – Seeq can connect and have you up and running in minutes.
Seeq is a data analytics software company that provides solutions for manufacturing and industrial companies. The software enables users to access, analyze and share process and production data in real time to improve operational efficiency and make data-driven decisions. Seeq’s platform can be used to analyze data from a variety of sources, including process control systems, historical databases and other industrial data sources. Platform capabilities include process visualization, root cause analysis and compliance reporting.


