Sankey Diagram in PI Vision
The Werusys Sankey symbol can be used to display aggregated values in a diagram where the width of the link is proportional to the size of the value. Sankey diagrams are important tools for visualizing energy and material flows as well as inefficiencies and potential savings in the use of resources. These are often material flows in a process or energy consumption in a company. This gives the user the opportunity to get a quick overview of flows within his company.
The visualization by the Sankey symbol makes it possible to easily identify large flows within a company or process: They are useful to identify large contributions in an overall flow.
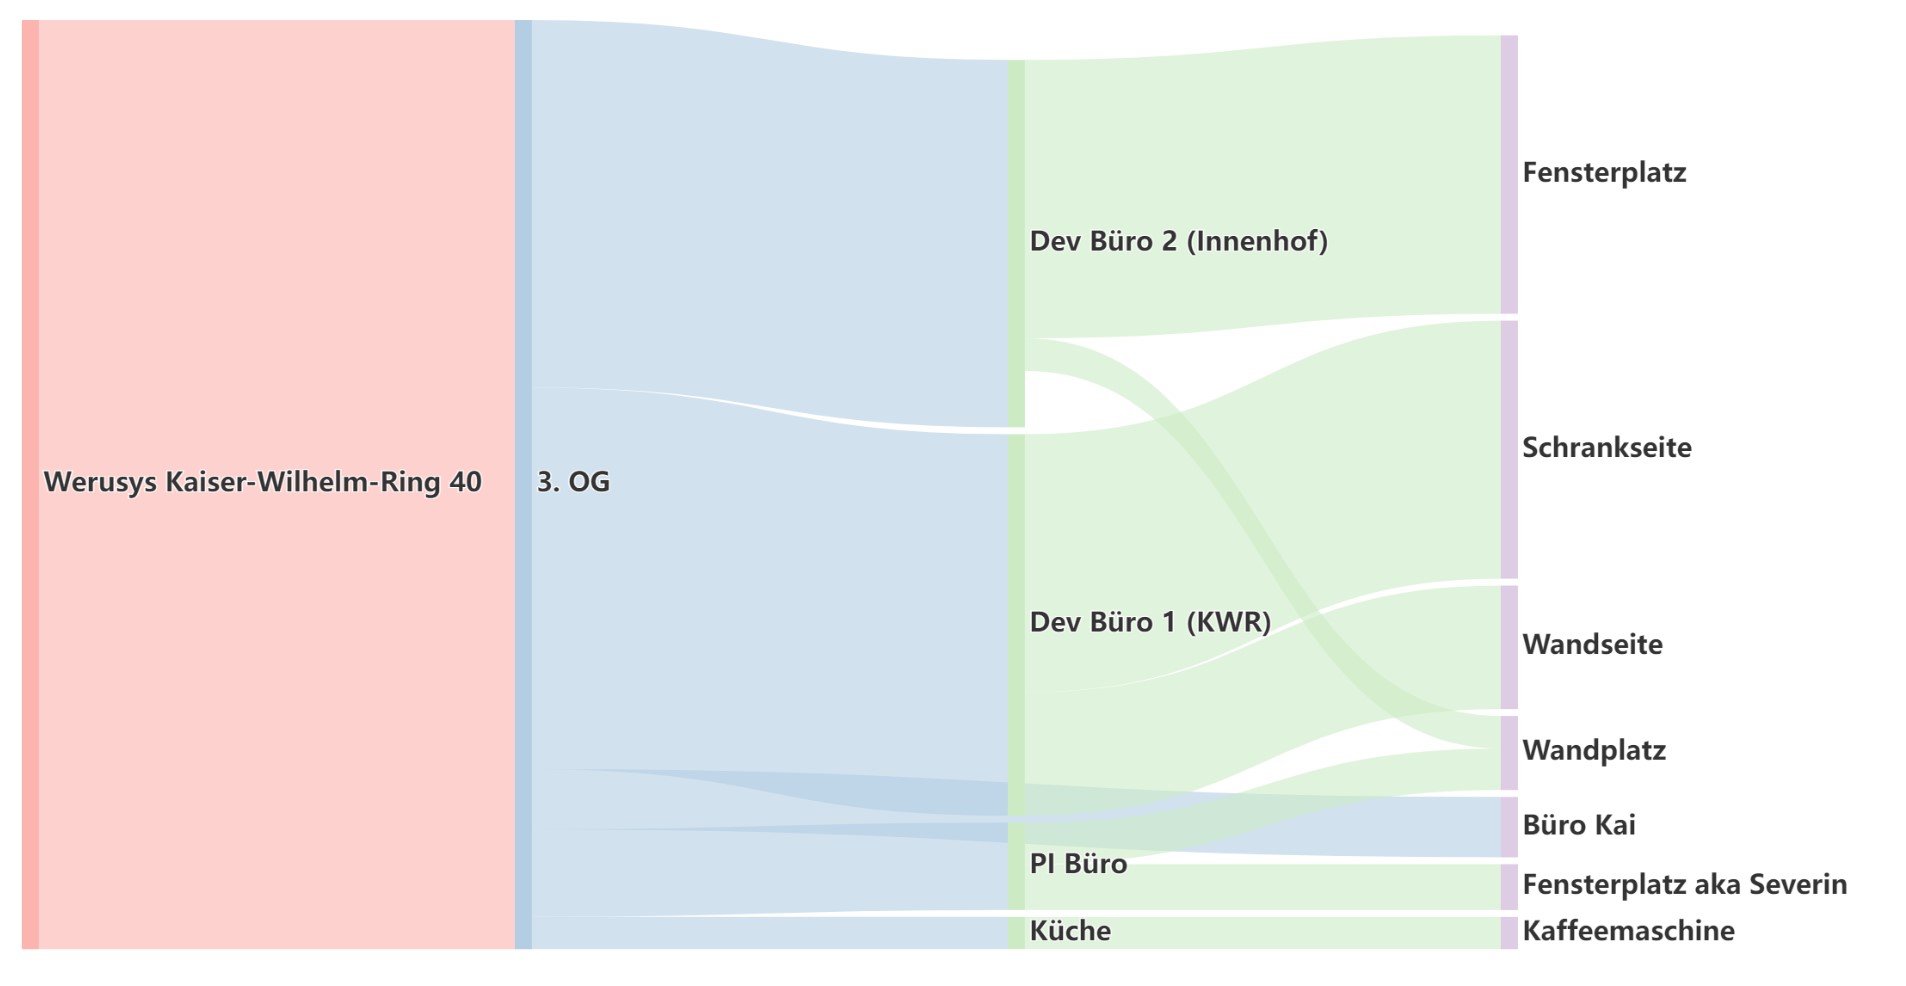
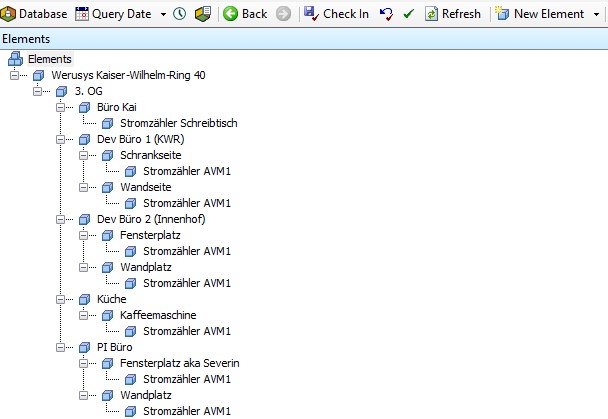
The Sankey diagram is configured very easily via AF and all displayed values are aggregated over the time period selected in PI Vision.
The Werusys PI Vision Suite
Get the most out of your PI system
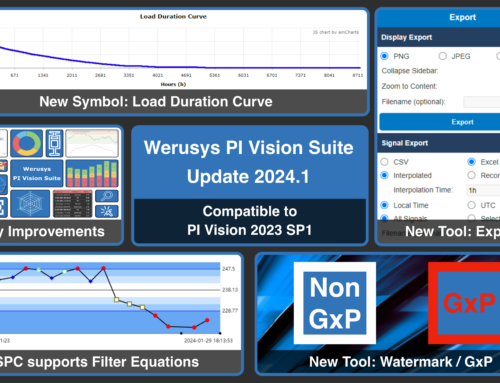
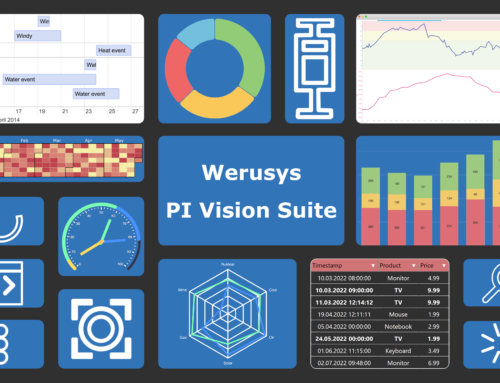
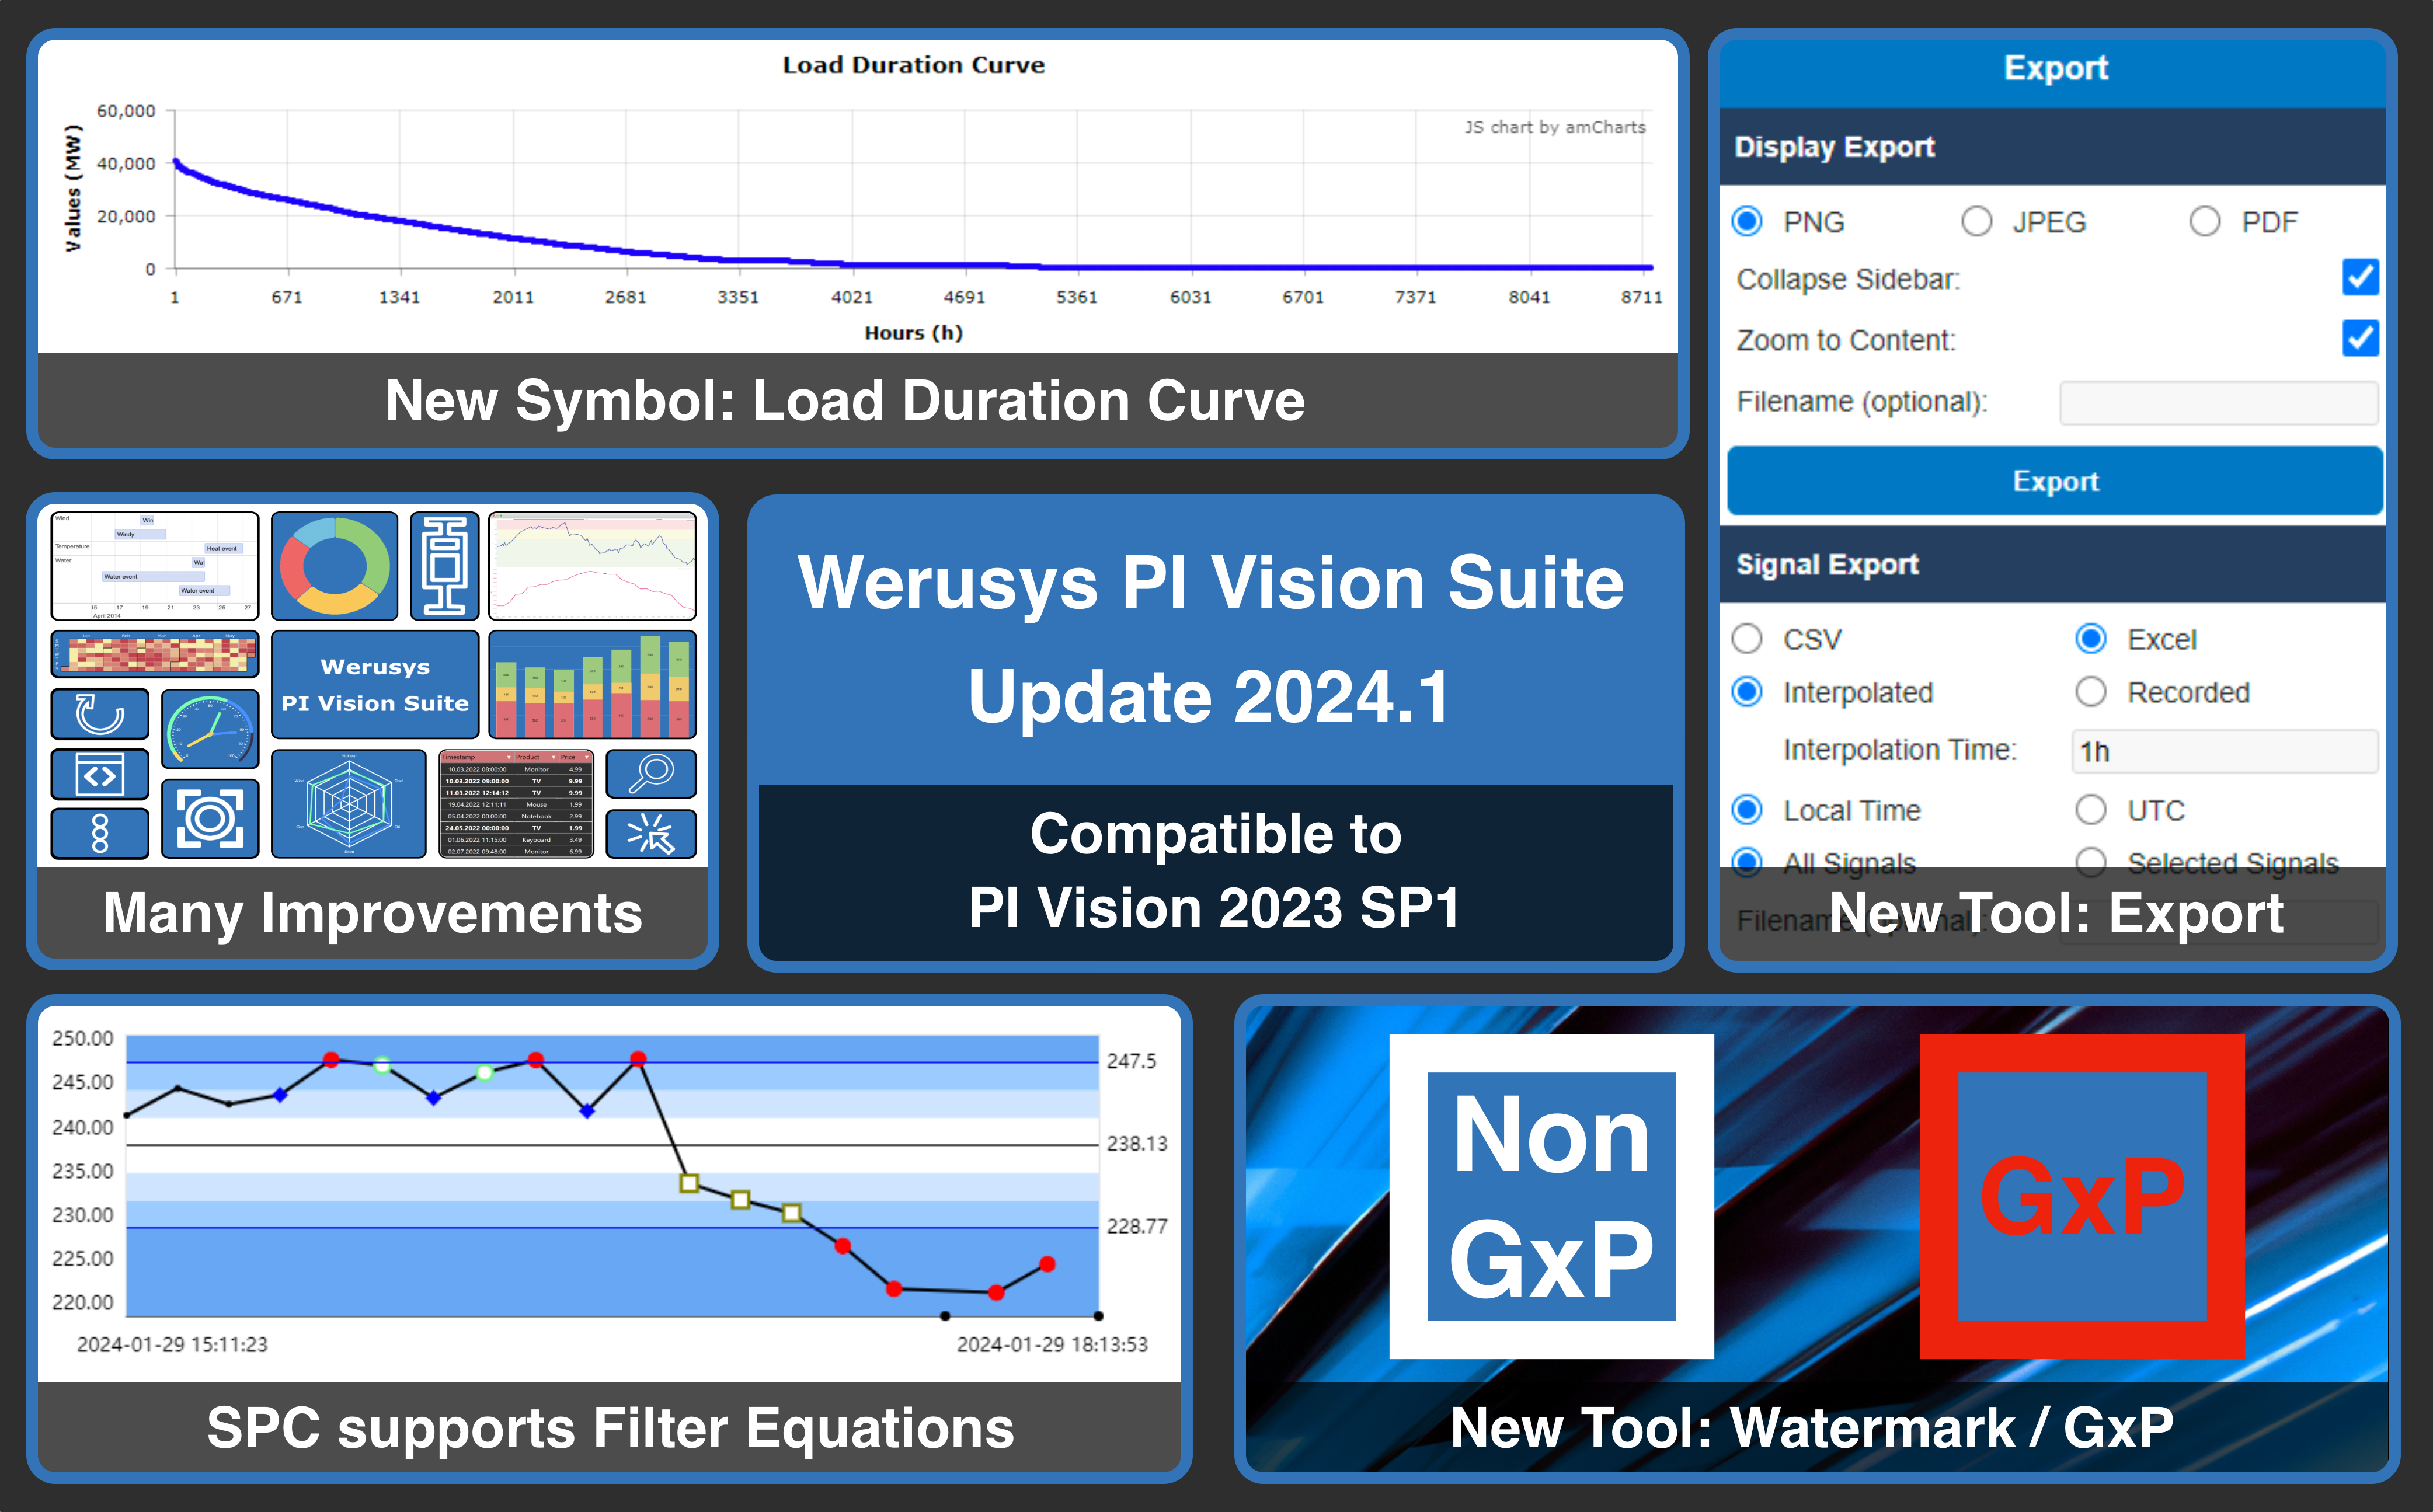
The Werusys PI Vision Suite expands your possibilities with the help of a wide range of new controls that are perfectly adapted to your needs. In addition, the PI Vision Suite allows you to embed Seeq analyses of any kind.
New opportunities
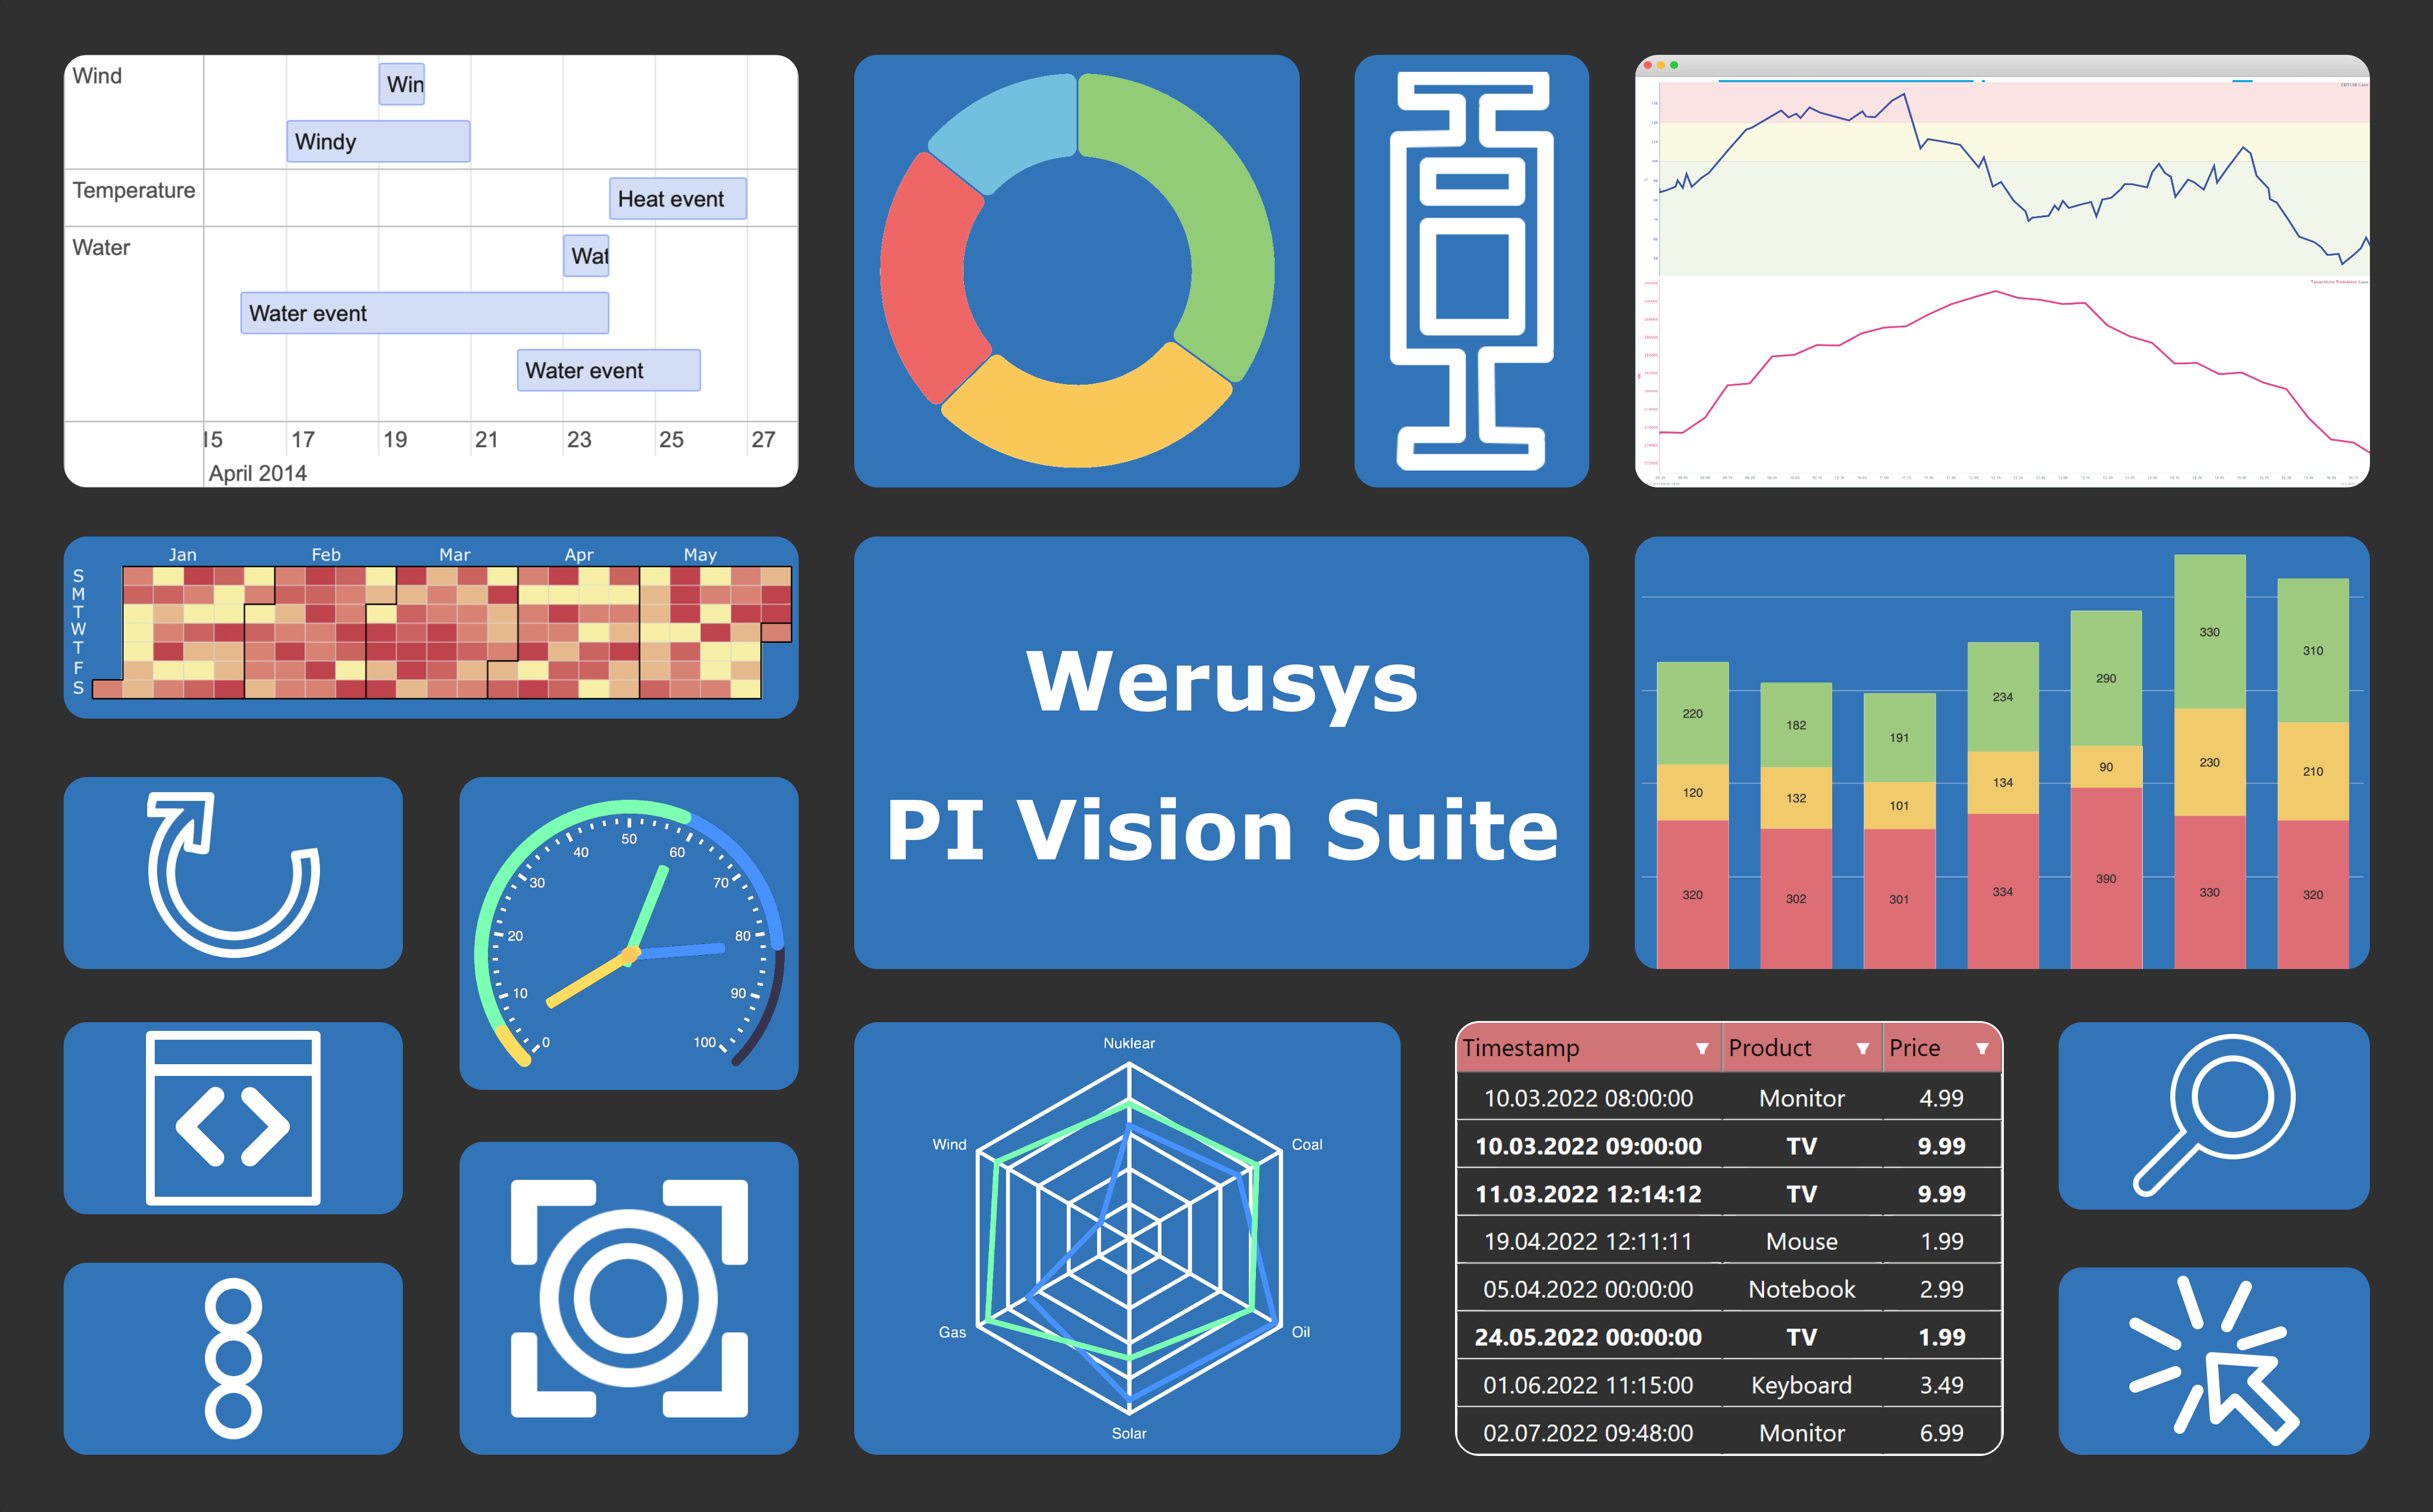
More than a dozen additional visualization options
Regular updates
Always up to date and ready to use for any PI Vision version
Embed Seeq analyses
Display analyses prepared in Seeq directly in PI Vision
First class support
Direct contact with PI System experts around the clock

Seeq
Accelerated Insights, Improved Outcomes
In the current hype around predictive analytics, machine learning, and data science, what’s missing are solutions to the real challenges to an analytics-driven organization. Tapping the expertise of your current employees. Support for collaboration and knowledge capture to foster sharing and reuse of analytics efforts. And the ability to rapidly distribute insights to the people who need them to quickly improve outcomes.
Intuitive. Visual. Innovative.
Seeq is the first application dedicated to process data analytics. Search your data, add context, cleanse, model, find patterns, establish boundaries, monitor assets, collaborate in real time, and interact with time series data like never before.
Fast. Flexible. Collaborative.
Whatever your process historian or operational data system of record – the OSIsoft® PI System®, Honeywell’s Uniformance® PHD, Emerson DeltaV and Ovation, Inductive Automation’s Ignition, AspenTech IP.21, Wonderware, GE Proficy or any other – Seeq can connect and get you working in minutes.


